Do any of the major U.S. stock market sectors systematically lead or lag the overall market, perhaps because of some underlying business/economic cycle? To investigate, we examine the behaviors of the nine sectors defined by the Select Sector Standard & Poor’s Depository Receipts (SPDR) exchange traded funds (ETF):
Materials Select Sector SPDR (XLB)
Energy Select Sector SPDR (XLE)
Financial Select Sector SPDR (XLF)
Industrial Select Sector SPDR (XLI)
Technology Select Sector SPDR (XLK)
Consumer Staples Select Sector SPDR (XLP)
Utilities Select Sector SPDR (XLU)
Health Care Select Sector SPDR (XLV)
Consumer Discretionary Select SPDR (XLY)
Using monthly dividend-adjusted closing prices for these ETFs, along with contemporaneous data for SPDR S&P 500 (SPY) as a benchmark, during December 1998 (sector ETF inception) through August 2021, we find that:
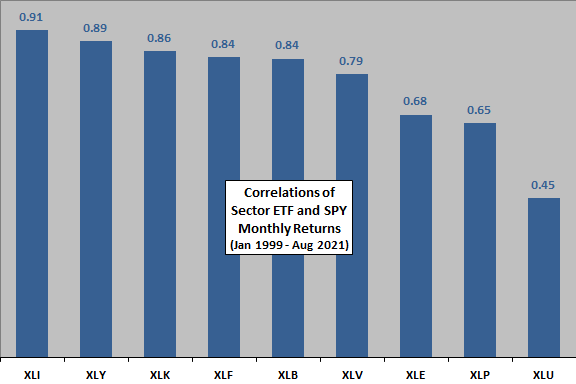
The following chart summarizes correlations of coincident monthly returns for each of the nine sector ETFs with the monthly returns of SPY over the available sample period, in order of decreasing correlation. Utilities, consumer staples and energy have the lowest correlations and are therefore the best candidates for market leaders or laggers. Utilities are arguably somewhat bond-like, and both energy and staples are somewhat commodity-like.
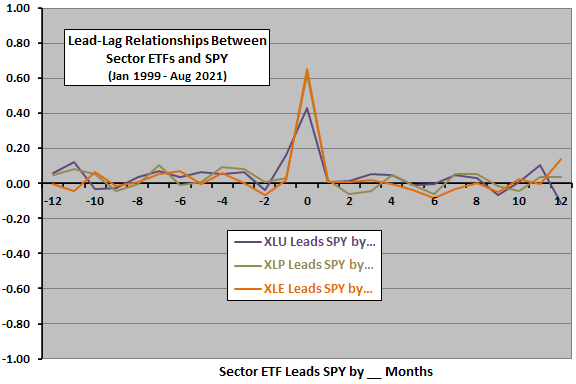
To test for lead-lag relationships, we calculate correlations for the monthly returns of each ETF offset by intervals ranging from -12 months (sectors lag the market) to +12 months (sectors lead the market) with respect to monthly returns of SPY. If there is a systematic leading or lagging relationship between a sector ETF and SPY of a year or less, it should emerge as a notably positive or negative correlation over this range of offsets.
The following chart shows the offset correlations for the utilities, consumer staples and energy sector ETFs (the three sector ETFs with the lowest coincident correlations with SPY). The coincident correlations are clearly strongest, but there is a hint that utilities have some tendency to lag the overall stock market by a month. Correlations for other sector-market lead-lag relationships appear to be noise.
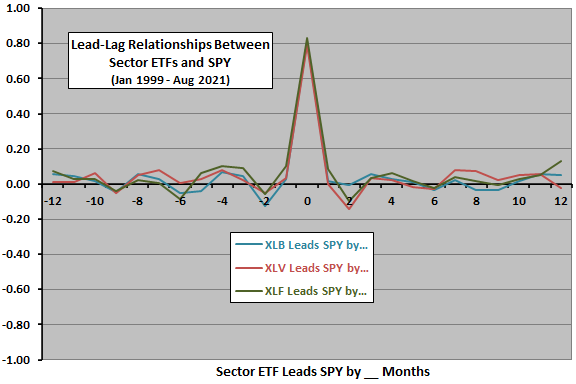
The next chart shows the offset correlations for the materials, financial and health care sector ETFs. The coincident correlations dominate, and correlations for other sector-market lead-lag relationships appear to be noise. There may be a slight scalloping of lead-lag correlations, perhaps associated with synchronized dividends.
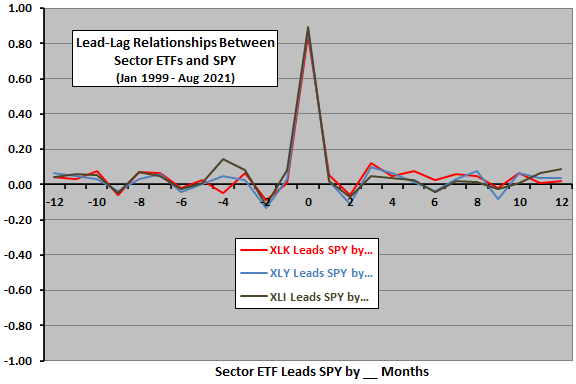
The final chart shows the offset correlations for the consumer discretionary, industrial and technology sector ETFs (the three sector ETFs with the highest coincident correlations with SPY). The coincident correlations again dominate, and correlations for other sector-market lead-lag relationships appear to be noise. Again, synchronized dividends may account for the slight scallop pattern across offset intervals.
In summary, there is little evidence that any equity sector ETFs reliably lead or lag the overall U.S. stock market over the past 23 years. Utilities may slightly lag the broad market.
Cautions regarding findings include:
- The sample is small in terms of the number of underlying business/economic cycles.
- Other ways of specifying sectors (or industries) may produce different results.