Do stock indexes behave predictably after extreme price levels, such as 52-week highs and 52-week lows? To investigate, we consider the behaviors of the Dow Jones Industrial Average (DJIA), the S&P 500 Index and the NASDAQ Composite Index over the 13 weeks after 52-week highs and lows during their available histories. Using weekly levels of these indexes from October 1928, January 1950 and February 1971, respectively, through January 2013, we find that:
Over the respective available sample periods:
- DJIA has 707 52-week highs and 192 52-week lows (ratio 3.7:1).
- The S&P 500 Index has 591 52-week highs and 129 52-week lows (ratio 4.6:1).
- The NASDAQ Composite Index has 389 52-week highs and 105 52-week lows (ratio 3.7:1).
Highs (lows) tend to cluster during bull (bear) markets.
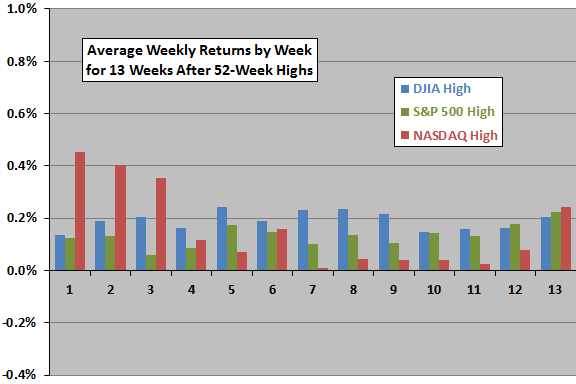
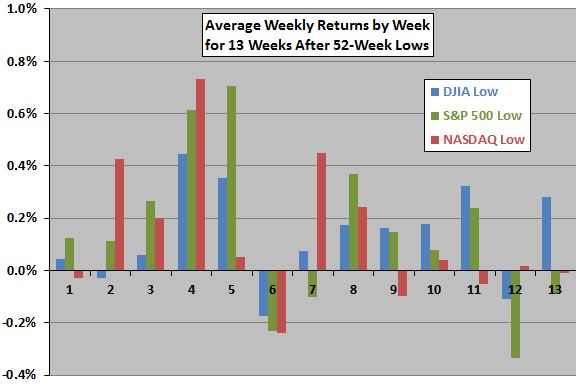
The following two charts summarize average returns by week for 13 weeks after 52-week highs (upper chart) and 52-week lows (lower chart) over the available sample periods. The average weekly returns for DJIA, the S&P 500 Index and the NASDAQ Composite Index over these sample periods are 0.12%, 0.16% and 0.20%, respectively.
Results indicate that weekly returns during the quarter after 52-week highs (lows) tend to be positive and placid (volatile with an initial reversal).
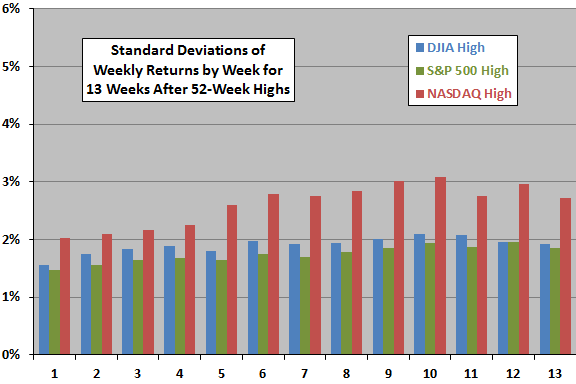
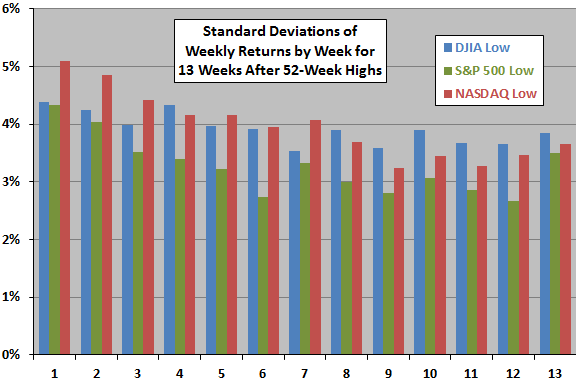
For a different perspective, we look at standard deviations of weekly returns.
The next two charts summarize standard deviations of weekly returns by week for 13 weeks after 52-week highs (upper chart) and 52-week lows (lower chart) over the available sample periods. The standard deviations of all weekly returns for DJIA, the S&P 500 Index and the NASDAQ Composite Index over these sample periods are 2.47%, 2.08% and 2.79%, respectively.
Results indicate that indexes tend to exhibit low but rising (high but falling) volatility during the quarter after 52-week highs (lows).
How do the average returns by week translate into cumulative returns?
The final three charts summarize average cumulative returns during the 13 weeks after 52-week highs and lows for DJIA (upper chart), the S&P 500 Index (middle chart) and the NASDAQ Composite Index (lower chart) over the available sample periods. For comparison, each chart includes the trend based on average weekly return over the available sample period for the applicable index.
Results are inconsistent across indexes/sample periods, undermining belief in predictable equity market behavior after index 52-week highs and lows.
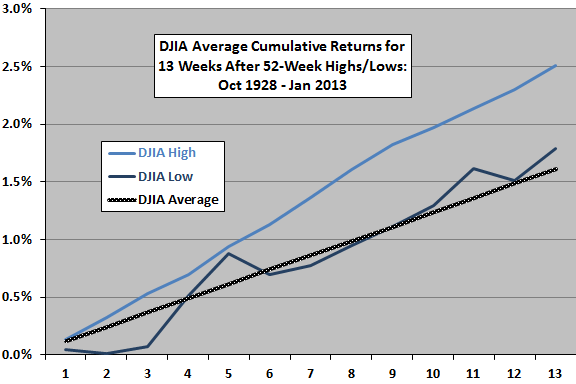
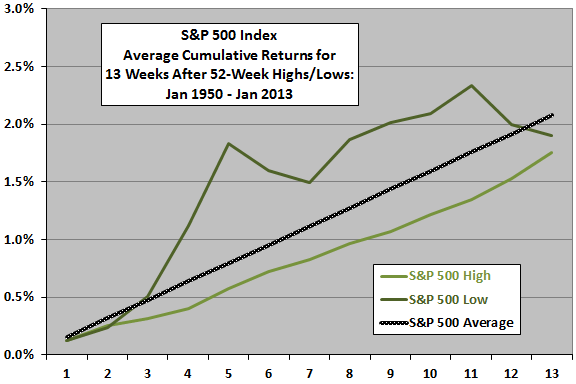
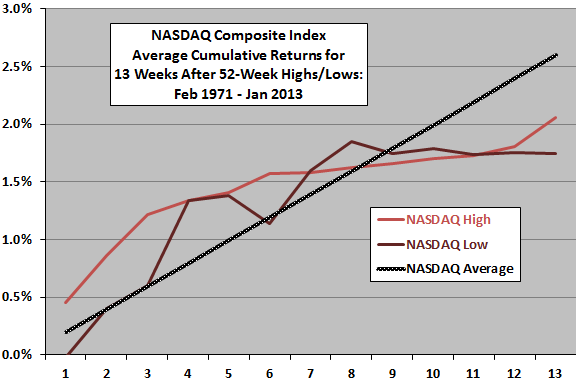
In summary, evidence from simple tests on three indexes indicates that equity markets tend to be relatively placid (volatile) during the quarter after 52-week highs (lows), with cumulative performances inconsistent across indexes/sample periods.
Cautions regarding findings include:
- As noted, sample periods differ across indexes.
- Clustering of 52-week highs and lows, such that subsequent 13-week return measurement intervals overlap, may distort cumulative return statistics. From a practical perspective, all observations are not independently tradable.