Does the distribution of analyst buy-hold-sell ratings predict the overall stock market? Is the distribution of ratings for a given firm indicative of the value of those ratings to investors? In the September 2005 version of their paper entitled “Buys, Holds, and Sells: The Distribution of Investment Banks’ Stock Ratings and the Implications for the Profitability of Analysts’ Recommendations”, Brad Barber, Reuven Lehavy, Maureen McNichols and Brett Trueman analyze the distribution of stock ratings at investment banks and brokerage firms and examine whether these distributions can be used to predict the profitability of analysts’ recommendations. Using 438,000 recommendations issued on more than 12,000 firms by 463 investment banks and brokerage firms from January 1996 through June 2003, they conclude that:
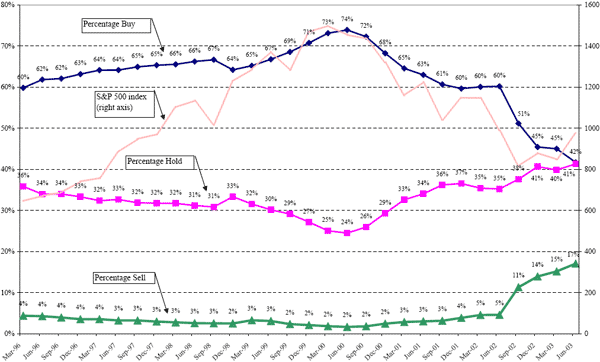
- The percentage of buy recommendations increases substantially from 3/96-6/00, peaking at 74%, but decreases substantially thereafter. (See the chart below.)
- There is persistence over time in the percentage of buy recommendations for given broker.
- Stocks upgraded to buy by brokers with the lowest percentage of buy recommendations advance by an average of 50 basis points per month more than stocks upgraded to buy by brokers with the highest percentage of buy recommendations.
- Stocks downgraded to hold or sell by brokers issuing the highest percentage of buy recommendations decline by an average of 46 basis points per month more than stocks downgraded to hold or sell by brokers issuing the lowest percentage of buy recommendations.
- A portfolio strategy seeking to capture these two types of outperformance may not have been profitable due to the large number of stocks, and therefore high transaction costs, involved.
- Stocks of small firms contribute disproportionately to both types of outperformance.
- Both types of outperformance have diminished since 2002, when rules began requiring that analyst research reports include the issuing firm’s overall distribution of buys, holds and sells.
The following chart, taken from the paper, shows the distributions of buys, holds and sells and the the S&P 500 index using end-of-quarter measurements from March 1996 through June 2003. The evolution of distributions suggests that analysts as a group are trend-followers rather than contrarians. They are most bullish (bearish) when the stock market is high (low). The chart shows a marked change in aggregate analyst behavior in 2002 when: (1) the stock market declined dramatically; and, (2) rules began requiring that analyst research reports include the issuing firm’s overall distribution of buys, holds and sells.

In summary, aggregate distribution of analyst recommendations is a coincident or lagging stock market indicator, and those firms that appear to be most realistic (honest) with their distribution of recommendations provide the best advice.