In considering the stock ratings of expert analysts, should investors focus more on the level of the ratings or changes in ratings? In their December 2007 paper entitled “Ratings Changes, Ratings Levels, and the Predictive Value of Analysts’ Recommendations”, Brad Barber, Reuven Lehavy and Brett Trueman investigate the potential value to investors of both levels of (strong buy, buy, hold, sell, strong sell) and changes in analyst stock ratings. Using real-time analyst stock ratings from two databases spanning 1986-2006 (more than 1,000,000 ratings) and contemporaneous daily stock returns, they conclude that:
- Buy/strong buy rating announcements outnumber sell/strong sell announcements by a factor of about 5.5. Upgrades and downgrades each comprise roughly one fifth of all rating announcements.
- Average daily abnormal returns generally decrease with rating, ranging from +1.0 basis point for strong buys -2.4 basis points for strong sells.
- Upgrades (downgrades) are associated with an average daily abnormal return of +1.9 (-1.0) basis points. Returns do not increase with upgrade magnitude (number of levels), but they do decrease with downgrade magnitude.
- For a given type (upgrade or downgrade) and magnitude (number of levels) of a ratings change, buy and strong buy ratings outperform hold, sell and strong sell.
- For a given rating level, upgrades outperform downgrades. For example, upgrades to buy beat downgrades to buy by an average 2.7 basis points per day.
- Both rating levels and changes predict future unexpected earnings, indicating that analysts have some ability to discover valuable private information about future earnings. Their rating actions do not simply elevate or depress investor demand for specific stocks.
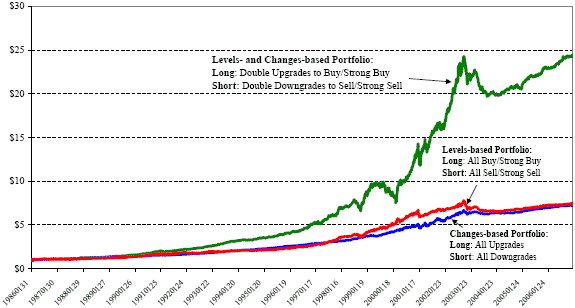
The following chart, taken from the paper, plots the cumulative values of $1 initial investments in three hedge portfolios over the period 1986-2006. The Levels-based Portfolio is long (short) all stocks rated buy or strong buy (sell or strong sell). The Changes-based Portfolio is long (short) all upgraded (downgraded) stocks. The Levels- and Changes-based Portfolio is long (short) stocks receiving a double upgrade to buy or strong buy (a double downgrade to sell or strong sell). The investments in the first two portfolios each grow to just over $7, while that in the third grows to over $24. Results do not incorporate trading costs/frictions, which are likely significant.

In summary, investors may find edges by considering both the levels of and changes in analyst stock ratings, with the combination more powerful than the separate indications.
It would be useful to know whether these indications have weakened in recent years, especially since the information-leveling Regulation FD (Fair Disclosure) effective October 2000.