Do the favorite equity investments of stock market newsletter gurus reliably outperform the market? One way to answer this question is a test of the performance of the favorite investments identified in the historical reports at NewsletterAdvisors.com published from 11/1/05 to 11/1/07. In each of these seven reports, a group of “top investment gurus reveal their favorite investment ideas.” NewsletterAdvisors.com is published by Business Financial Publishing, “a diversified publisher of investment news, research, and analysis for individual investors through paid subscription newsletters, free e-letters, and regular special reports.” Using historical price data from Yahoo!Finance for the sample of 70 favorite investments in in the seven reports and contemporaneous S&P Depository Receipts (SPY) performance data for benchmarking, we find that:
Specifically, we analyze the performance of the 70 favorite investments of stock market newsletter gurus from the following NewsletterAdvisors.com reports:
- “Top Ten Stocks for 2006” (published 11/1/05)
- “Eight Outstanding Investments” (published 3/1/06)
- “Eleven Winning Investments” (published 7/7/06)
- “Top 10 Stocks for 2007” (published 11/2/06)
- “Nine Favorite Stocks for 2007” (published 3/12/07)
- “Ten Outstanding Investments” (published 7/9/07)
- “Top 12 Stocks for 2008” (published 11/1/07)
The emphasis on annual outlooks and “investments” implies that the gurus see the favorite picks in these reports as long-term holdings. We therefore test performance on a largely annual horizon via the following methodology:
- Buy each favorite investment at the adjusted close (thereby accounting for dividends and splits) on the day after the report publication date.
- Sell each investment at the adjusted close on the report anniversary date.
- Since the last two reports are less than one year old, sell at the close on 5/9/08.
- When a guru picks the same favorite in multiple reports, include it each time.
- In the cases of three stocks for which Yahoo!Finance now offers no historical price data (CDWC, CLRK, AXCA), estimate buy and sell prices from the historical charts at Marketocracy.
- For one stock acquired by another firm during the performance horizon (QMAR), sell at the close on 4/15/08 (the last date traded) rather than 5/9/08.
- Ignore trading fees and frictions.
For several favorites, we had to track down historical prices on specific exchanges.
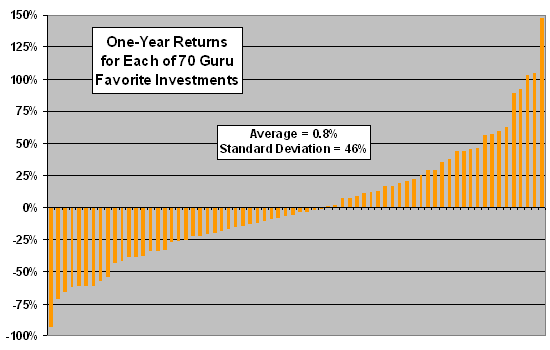
The following chart shows the resulting returns for each of the 70 favorite investments, ranked from lowest (most negative) return to highest return. Returns for 39 (31) of the 70 favorites are negative (positive). The average return of all 70 favorites is 0.8% with a very large 46% standard deviation of returns.
To benchmark this performance, we group favorite investments by report publication date.

We take the following additional steps to compare the returns of guru favorite investments to the market return:
- Form equally weighted portfolios of favorites by publication date. As indicated by the above report titles, groups range in size from eight to 12 favorites.
- For each portfolio of favorite investments, contemporaneously buy and sell SPY at the close and calculate its return as a proxy for the performance of the overall stock market.
- For overall performance, compare the average return of the seven favorites portfolios to the average return of the associated seven SPY round trips.
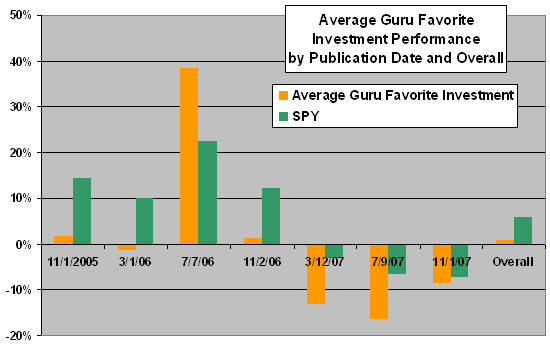
The next chart summarizes results of this portfolio analysis. The favorites portfolios underperform SPY in six of seven cases. The average of the seven portfolios underperforms the average of the SPY holdings by roughly 5%.

Buy prices of six (14) of the 70 favorites are under $5.00 ($10.00). This fact, along with the very high standard deviation of individual favorite returns, suggests that NewsletterAdvisors.com mischaracterizes the picks as investments rather than speculations. It seems that, when presenting their favorite investments, participating guru may often be swinging for the fences with high-risk picks that on average underperform the market at an investment horizon. (See our blog entry of 4/23/07 for a summary of research finding that investors tend to overpay for volatile stocks, especially during bear markets.)
Subsamples by guru are not large enough to evaluate individual stock-picking performances reliably.
In summary, investors should beware of the favorite equity investments of stock market newsletter gurus. Many favorites may be swing-for-the-fences speculations.