Can long-term investors who periodically rebalance their portfolios materially enhance performance by using short-term signals to “permit” rebalancing? In their April 2010 paper entitled “To Trade or Not to Trade? Informed Trading with High-Frequency Signals for Long-Term Investors”, Roni Israelov and Michael Katz test the effects of such a tactical “informed trading” twist on long-run portfolio performance, focusing on the net Sharpe ratio as the bottom line discriminator. As an example, they apply one-week reversal signals to rebalancing a value-momentum portfolio that selects high value (book-to-market), high momentum (12-month past return) country indexes from among developed markets. Using book-to-market and return data for 18 developed markets over the period 1980-2009 (30 years), they conclude that:
- For a given rebalancing frequency, “informed trading” reduces trading costs (because the short-term signal defers some trades).
- Informed trading enhances long-term portfolio performance by avoiding those rebalancing trades that would transfer wealth to short-term traders.
- Informed trading tends to shorten optimal portfolio rebalancing frequency because the information in the short-term signal decays rapidly. For example, applying a weekly reversal signal to inform rebalancing of the country index momentum-value portfolio described above:
- Reduces optimal rebalancing frequency from 15 days to two days.
- Boosts optimal net Sharpe ratio from 0.56 to 0.62 over the entire sample period, with additional costs from more frequent rebalancing more than offset by enhanced gross performance.
- For simulated portfolios, optimal net Sharpe ratio improves from 0.64 for the long-term portfolio alone to 0.68 for the informed trading portfolio.
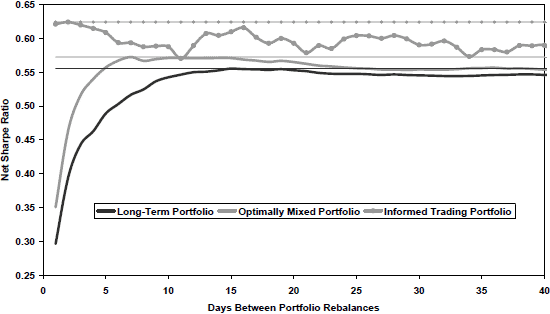
The following chart, taken from the paper, compares long-term net Sharpe ratios of three alternative portfolios based on the country index value-momentum strategy described above for rebalancing frequencies ranging from one day to 65 days:
- The Long-Term Portfolio uses only the long-term value (book-to-market) and momentum (12-month lagged return) signals with set rebalancing frequencies.
- The Optimally Mixed Portfolio uses optimized, fixed weighting factors to combine the short-term weekly reversal and long-term momentum-value signals.
- The Informed Trading Portfolio uses the short-term signal to decide whether to execute or delay each rebalancing action.
The assumed trading friction for all three portfolios is 0.10% one way. The chart shows that the trading frequency that maximizes net Sharpe ratio differs among the strategies, and that the informed trading approach wins at nearly all trading frequencies.

In summary, evidence suggests that long-term investors may be able to boost net Sharpe ratio by using high-frequency signals to make trade-or-delay decisions at each scheduled portfolio rebalancing.
Some considerations regarding this analysis are:
- Intensive comparison of rebalancing frequencies across multiple portfolio models may introduce material data snooping bias, resulting in overstatement of expected returns for the winning combinations.
- The assumed level of trading friction in the example (0.10% one way) may be unrealistically low for investable implementations of country indexes over the sample period (especially for individual investors).
- The rebalancing frequency optimization process appears to incorporate look-ahead bias. An investor operating in real time would not have known the frequency optimal for the entire sample period.