Which firm fundamentals predict associated stocks returns, and which ones do not? In their February 2011 paper entitled “Returns Premia on Company Fundamentals”, Kateryna Shapovalova, Alexander Subbotin and Thierry Chauveau assess the significance, stability and interplay of excess returns for individual stocks as predicted by widely used firm fundamentals. Specifically, they consider: book-to-price ratio; earnings-to-price ratio; sales-to-price ratio; cash flow-to-price ratio; dividend yield; market capitalization; growth in sales per share over the past one, three and five years; growth in earnings per share over the past one, three and five years; forecasted growth of earnings per share next year; forecasted long-term growth in earnings per share; forecasted earnings-to-price ratio; five-year average reinvested fraction of return on equity (internal growth); and, for control purposes, past returns over one, three and 12 months. Their methodology is direct stock-by-stock rather than portfolio-mediated, with the values of fundamentals across stocks normalized to a range of zero to one. They impose a three-month lag for accounting data to ensure public availability. Using monthly/quarterly firm fundamentals and monthly total stock returns for 9,363 NYSE-listed firms during 1979 through 2008, they find that:
- Book-to-price ratio, market capitalization, one-year sales growth and internal growth significantly predict future stock returns, but earnings history and earnings forecasts do not. Over the entire sample period, average quarterly premiums are:
- 3.3% for book-to-price ratio (high outperforms low, the value premium).
- 3.0% for internal growth (high outperforms low).
- 1.8% for market capitalization (small outperforms large, the size effect).
- 1.4% for one-year sales growth (high outperforms low).
- One-year changes in fundamentals work better than long-term (five-year) average changes, consistent with the notion that new information is most important.
- The predictive powers of firm fundamentals vary over time, but they exhibit no momentum or patterns. In other words, a relatively high or low premium this quarter does not predict the change in premium for next quarter. The size effect exhibits the smallest downside variation.
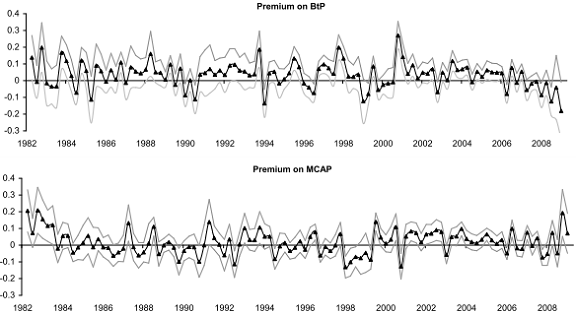
- Uncertainty in premium values increases during intervals of market stress (1982, 1987, 1991, 1998, 2000-2002 and 2008).
- There is no reliable relationship between the value premium and the size effect (see the graphs below). Premiums for one-year sales growth and internal growth tend to vary together, with the market return and with the value premium.
- Controlling for price momentum has little or no effect on premiums for firm fundamentals.
The following graphs, taken from the paper, depict time variation in the value premium (Premium on BtP) and the size effect (Premium on MCAP) as measured at a quarterly frequency. Light gray lines denote 95% confidence intervals for the premiums, which tend to expand during market crises. The two premiums vary considerably but appear not to move together.

In summary, evidence from stock-by-stock analysis indicates that book-to-price ratio, internal growth, market capitalization and one-year sales growth significantly predict returns for U.S. stocks over the past 30 years, but indicators based on past and forecasted earnings do not.
Note that all return/premium calculations in this study are gross. Including simple estimates of trading frictions would materially lower the estimated premiums. Moreover, there may be relationships between liquidity (bid-ask spread) and fundamentals such that trading frictions work explicitly against premiums. For example, small stocks and value stocks may tend to have higher trading frictions than large stocks and growth stocks, respectively.