Are there internal or external signals that predict financial market panic attacks? In the February 2011 revision of their paper entitled “Predicting Economic Market Crises Using Measures of Collective Panic” (flagged by a reader), Dion Harmon, Marcus de Aguiar, David Chinellato, Dan Braha, Irving Epstein and Yaneer Bar-Yam investigate whether indications of the interplay between external shocks (news) and internal market mimicry (herding) predict U.S. stock market crises and panics. They measure the relative levels of external news and internal mimicry based on the distribution over a year of the daily fraction of stocks that move in the same direction (simply up or down). A strongly Gaussian (flattened) shape for this distribution implies that investors are focusing on business fundamentals (technical indications), and external news (internal mimicry) is therefore dominating their behavior. Left-right symmetry of this distribution implies that good news and bad news are in balance. Using random samples of daily returns of Russell 3000 stocks over the period 1985 through 2010, they find that:
- During 2000-2008:
- Annual distributions of daily co-movement progressively flatten, suggesting gradual decline in the importance of external news relative to herding.
- All annual distributions are essentially symmetric, suggesting approximate balance between good and bad news.
- Therefore, internal market mimicry (rather than negative news) drove a self-organized 2008-2009 crash.
- During 1985-2010, extended intervals of relatively high levels of internal market mimicry precede prominent panics/crises, further suggesting that uncertainty and nervousness (mimicry/herding) rather than external news drive panics in a predictable sequence (see the chart below).
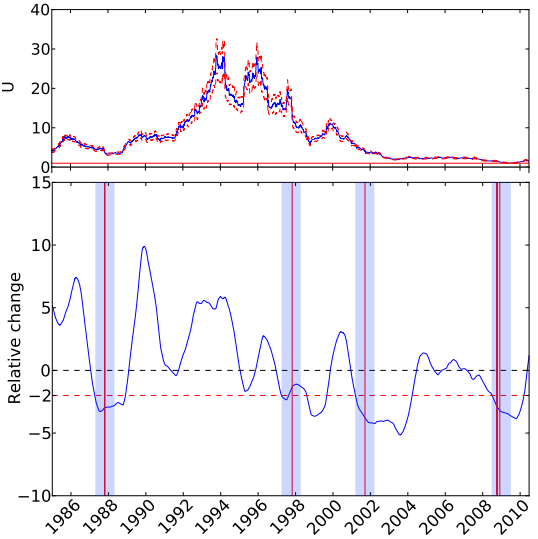
The following chart, taken from the paper, relates changes in the relative importance of internal mimicry and external news to stock market panics over the period 1985-2010, as follows:
The upper graph shows the level of external good news (U) inferred from characteristics of rolling one-year distributions of daily stock co-movement calculated from samples of more than 140 stocks, with one standard deviation variability ranges. The study assumes, based on the empirical data for 2000-2008, that good news and bad news are roughly in balance and additive rather than canceling such that U alone illustrates the level of external news.
The lower graph shows the contemporaneous annual change in U as a fraction of its average standard deviation over the previous year. Four gray-shaded windows denote one-year intervals after declines of two standard deviations in this parameter. Eight vertical red lines mark the most extreme percentage declines in the Dow Jones Industrial Average during the sample period (10/19/1987, 10/26/1987, 10/27/1997, 9/17/2001, 9/29/2008, 10/9/2008, 10/15/2008 and 12/1/2008). These panics are among the 20 most extreme declines ever for this index.
Results suggest that relative declines in the influence of external news (alternatively, relative increases in the importance of herding) systematically precede crises/panics.

In summary, evidence from a very small sample of crises/panics suggests that the U.S. stock market becomes relatively self-absorbed (herd-like) for extended intervals before panics.
While application of these concepts of complex system behavior to the stock market is interesting, reasons to be very cautious regarding findings include:
- The study neither proposes nor tests any trading strategies (timing of sell and cover actions) to exploit findings.
- The external news-related metric used in the 1985-2010 visualization test seems contrived and suggests data snooping. Bias from such snooping is of intense concern for small samples (eight events). Moreover, the eight events cluster such that only four are independent relative to the signal measurement interval.
- It appears that the authors may have selected parameters/windows/thresholds retrospectively (in-sample, based on the entire sample period). An investor operating in real time would not have know what thresholds to use. Regression and ranking tests that more continuously relate the signaling metric to future stock market returns may clarify.
- The study does not explore why the level of external news should vary so dramatically during 1985-2010, such that the absolute balance between external news and internal mimicry appears useless as a predictor of stock market behavior.