Are some firms more at risk of creative destruction by new technologies? If so, does the market offer a premium to investors in such firms? In his March 2011 paper entitled “Creative Destruction and Asset Prices”, Joachim Grammig explores the concept of creative destruction as an explanation for the size effect and the value premium under the proposition that associated firms have a higher probability of being destroyed by technological change. He defines the pace of technological change as the annual percentage change in U.S. patents issued (patent activity growth). Using annual counts of newly issued patent from the U.S. Patent and Trademark Office and annual data on 25 portfolios of U.S. stocks formed by double-sorts on size and book-to-market ratio over the period 1927 through 2008, he finds that:
- The average values for the gross annual size effect and value premium over the sample period are 3.6% and 5.1 %, respectively. Annual patent activity growth relates negatively to both.
- The annual gross creative destruction risk premium for small value (large growth) stocks is 6.2% (-2.4%), indicating a total gross creative destruction risk premium of 8.6% per year.
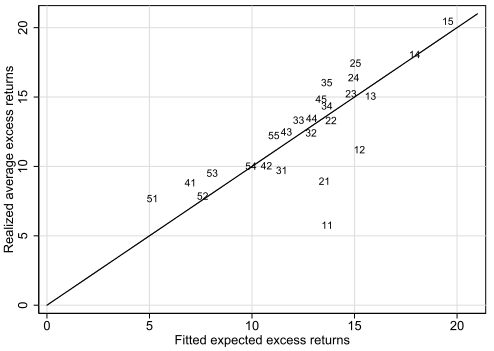
- A two-factor linear model based on market return and patent activity growth explains a large portion of the cross-sectional variation of portfolios sorted on size and book-to-market ratio, with the small-growth portfolio a notable exception (see the chart below).
- A robustness test using quarterly data from 1950 through 2008 shows that the Great Depression and World War II are not decisive in exposing the role of creative destruction risk in accounting for the size effect and value premium.
The following chart, taken from the paper, relates actual average annual excess gross returns (percent in excess of one-month Treasury bills) to those predicted by a two-factor linear model based on market return and patent activity growth for 25 portfolios double-sorted on size and book-to-market ratio over the entire 1927-2008 sample period. The first number denotes the size quintile (1 being the smallest and 5 the largest), and the second number the book-to-market ratio quintile (1 being the lowest and 5 the highest). Alignment along the 45-degree line indicates a good model fit. The model explains about 60% of the variation in actual returns across the 25 portfolios. It is particularly effective (ineffective) in predicting returns for small value portfolios 14 and 15 (small growth portfolio 11).

In summary, evidence indicates that creative destruction risk defined based on number of new patents issued explains substantial portions the size effect and value premium.
Cautions regarding findings include:
- As noted, return calculations are gross, not net. Trading frictions are large during part of the sample period, and frictions tend to be especially large for small stocks.
- There is arguably a delay of more than one year between patent issuance and market impact of innovation.
See “Does Aggregate Technological Innovation Predict Stock Returns?” for analysis of the relationship between patent activity and overall stock market returns.