What is the best way to incorporate commodities into a diversified portfolio? In her August 2011 paper entitled “Long-Short Commodity Investing: Implications for Portfolio Risk and Market Regulation”, Joelle Miffre studies the performance of long-short commodity strategies and their hedging properties with respect to traditional asset classes (proxied by the S&P 500 Index and Barclays Capital US Aggregate Bond Index), especially during crises. She calculates futures contract returns assuming that investors hold the nearest contract until one month to maturity and then roll to the second nearest contract. She considers four single-sort and four double-sort long-short strategies based on past return (momentum), roll return (term structure), positions of hedgers and positions of speculators. All eight strategies systematically take long (short) positions in commodities expected to appreciate (depreciate) based on these indicators. Using weekly (Friday) data for 27 commodity futures (12 agricultural, five energy, four livestock and five metal), the S&P-GSCI, the selected traditional asset class proxies and CFTC Commitments of Traders reports on positions of hedgers and speculators during October 1992 through March 2011, she finds that:
- Over the entire sample period, the average gross annual return of the single-sort (double-sort) long-short commodity strategies is 7.99% (9.03%), compared to 0.64% for the S&P-GSCI and 4.28% for a long-only equally weighted commodity strategy. The average annual Sharpe ratio of the eight long-short strategies is 0.51, ranging from 0.27 for the single-sort momentum strategy to 0.63 for the single-sort strategy based on positions of hedgers, compared to 0.20 for the S&P-GSCI and 0.05 for a long-only equally weighted commodity strategy.
- Conditional annualized volatilities of the eight long-short commodity strategies range from 15.1% to 17.6%, compared to 20.8% for the S&P-GSCI and 11.3% for a long-only equally weighted commodity strategy. Long-short commodity strategy volatilities tend to: (1) rise less than S&P-GSCI volatility when equity markets become more volatile; and, (2) fall when fixed income markets become more volatile (when long-only strategy volatilities tend to rise).
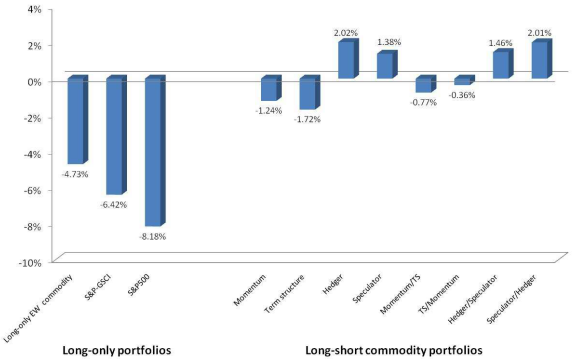
- Conditional correlations between the S&P 500 Index with long-short commodity strategies tend to be lower (about 0.00) than those with long-only commodity strategies (about 0.19), indicating superior risk diversification. When equity markets are exceptionally volatile, the conditional correlation between the S&P 500 Index and the long-short commodity strategies based on positions of hedgers and speculators (long-only commodity strategies) decreases (increases). (See the chart below.)
The following chart, taken from the paper, summarizes the weekly performance of the S&P 500 Index and both long-only and long-short commodity strategies during the four weeks after the demise of Lehman Brothers (September, 15 2008). The S&P 500 Index, the S&P-GSCI and the long-only equally-weighted portfolio of all commodities have weekly average losses of 8.2%, 6.4% and 4.7%, respectively. The eight long-short commodity strategies perform relatively very well, with those based on the positions of hedgers and speculators notable.

In summary, evidence indicates that investors may accrue both performance and diversification benefits by employing long-short (rather than long-only) commodity futures strategies based on momentum, roll return and (especially) known positions of commodity hedgers and speculators.
Cautions regarding findings include:
- Return calculations are gross, not net. Including reasonable trading frictions would reduce reported returns.
- Evaluation of multiple strategies on the same data set introduces data snooping bias, such that the best performance likely overstates reasonable out-of-sample expectations.
- Assumptions and calculations are complex, such that practical implementations (with management fees) may deviate.