Do U.S. stock market returns during the first and last hours of normal trading days reliably indicate what comes next? To investigate, we analyze average SPDR S&P 500 (SPY) returns during 9:30-10:30, 9:30-15:00, 9:30-16:00 and 15:00-16:00 for normal trading days during 2007 (bullish year) and 2008 (bearish year). Using a sample of SPY one-minute prices spanning 2007-2008, we find that:
There are two data quality issues:
- The daily opening and closing prices in the sample often deviate slightly from those for (unadjusted) SPY at Yahoo!Finance. Tick selection may be the reason, and the mismatches are probably not important.
- We exclude 7/22/08 from calculations due to missing data.
We also exclude shortened trading days (7/3/07, 11/23/07, 12/24/07, 7/3/08, 11/28/08 and 12/24/08), since early closes disrupt selected intraday intervals.
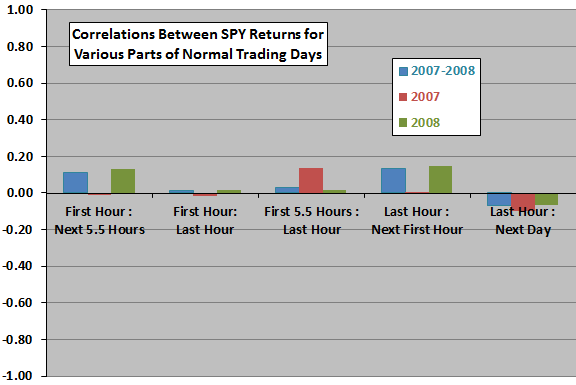
The following chart summarizes Pearson correlations for various pairs of intraday/daily SPY returns for the combined 2007-2008 sample and for each of 2007 and 2008. There are about 250 observations per year. Notable findings are:
- There is a modest positive correlation between the return during the first hour and the return for the rest of the day, but this result is not consistent for annual subsamples.
- There is a modest positive correlation between the return during the last hour of one day and the return for the first hour of the next day, but again this result is not consistent for annual subsamples.
- There is a modest negative correlation between the return during the last hour of one day and the return for the entire next day, and this result is consistent for annual subsamples.
- There is consistently no relationship between returns for the first and last hours of the same day.
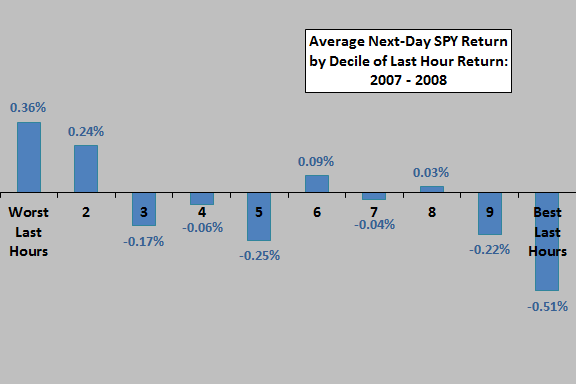
To assess non-linearity of the last hour/next day finding, we measure average next-day return by range of last-hour return.

The final chart shows average next-day SPY returns across deciles of last-hour returns for the entire sample (about 50 observations per decile). Distribution tail effects appear to determine the relationship, with returns after the weakest (strongest) tenth of last hours indicating relatively strong (weak) next-day average returns. However, standard deviations of tail returns are much higher than those of middle deciles, inhibiting exploitability.

In summary, evidence from simple tests on intraday intervals hints at some tendency for reversal of last-hour U.S. stock market returns the next day.
Cautions regarding findings include:
- As noted, correlations are all small and may not be exploitable on a net basis.
- Analyses are in-sample. An investor operating in real time using only historical data may have drawn different conclusions.
- Results may be different for different years due to randomness and/or market adaptation.