Are momentum trading strategies reliable and economically significant after trading frictions for large-capitalization stocks? In his November 2006 paper entitled “Alpha Generating Momentum Strategies”, Gregor Obrecht test 32 momentum trading strategies on large-capitalization U.S. stocks. The strategies encompass all combinations of: formation periods of three, six, nine and 12 months; wait periods of zero months and one month; and, holding periods of three, six, nine and 12 months. Using monthly returns for S&P 100 stocks over the period 12/85-8/06, he concludes that:
- All 32 hedge portfolios that are long (short) the tenth of stocks with the highest (lowest) momentum generate positive alpha before trading frictions. Results for 16 of 32 such portfolios are statistically significant. Use of a one-month wait period appears to be advantageous only for short holding periods.
- Focusing on the strategy using a six-month formation period, zero wait period and six-month holding period:
- Momentum returns are significant over 12/85-12/94 and 1/95-8/00 subperiods, but they disappear for 9/00-8/06. The most likely explanation for the breakdown is that momentum does not work during bear markets.
- Among large-capitalization stocks, momentum effects may be strongest in June, July and September.
- Adjustments for market, size and book-to-market risk factors do not explain momentum returns.
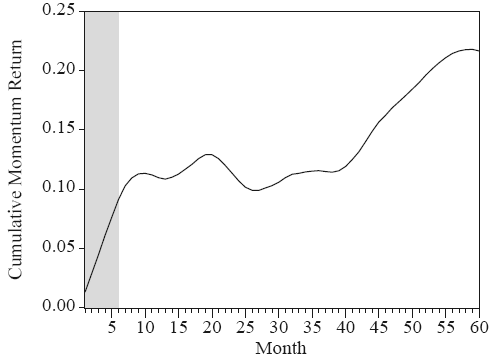
- Momentum returns are more likely an adjustment to past underreaction than an overreaction to recent events (see chart below).
- Inclusion of reasonable trading frictions leaves a net alpha of 2.33% over six months (growing to 7.55% for a 10-month holding period).
The following chart, taken from the paper, shows the average cumulative return over 60 months after hedge portfolio formation based on past six-month momentum with no wait period. The shaded area indicates a nominal six-month holding period, which captures most of the abnormal returns available over the first year. Because the cumulative return does not revert toward zero, results suggest that momentum reflects adjustment to past underreaction rather than an overreaction in and of itself. Note that this figure omits the most recent 60 months of data in the sample due to unavailability of returns for the entire cumulative return window.

In summary, momentum trading strategies generally offer significantly positive alpha for large-capitalization U.S. stocks, but the strategies may not work during bear markets.