Does seasonal fear of stock market weakness or demand for jewelry drive gold prices? In his January 2012 paper entitled “The Seasonality of Gold – Jewelery Demand and Investor Behavior”, Dirk Baur examines calendar month seasonality of the price of gold. Using daily gold bullion spot prices (London fixing) and COMEX gold futures prices during 1981 through 2010 (30 years), along with contemporaneous stock market index and gold jewelry demand data, he finds that:
- The strong positive average daily gold returns of September and November are statistically significant. No other anomalies are evident.
- September (November) has an average monthly return of 2.2% (1.8%).
- The persistence of the September effect is remarkable.
- The strength of September and November effects has increased in the past years.
- Results hold after adjusting for stock market returns and volatility, general commodity prices and the value of the U.S. dollar.
- Daily gold returns are most volatile (have highest standard deviations) in September, followed by January and February.
- Gold jewelry demand data supports some belief that the wedding season in India and the pre-Christmas period in many industrial countries affect gold price.
- The finding that the September effect is stronger than the November effect supports belief that investors shift to gold as a haven from stock market weakness/volatility.
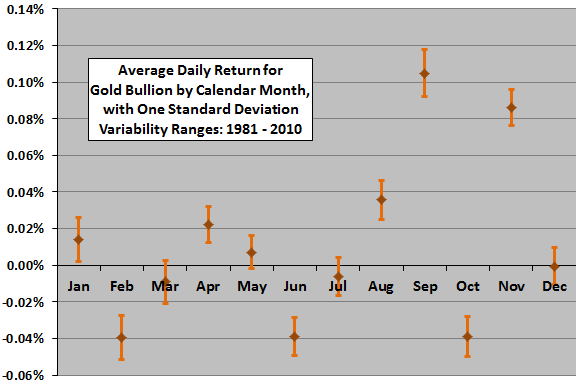
The following chart, constructed from data in the paper, summarizes average daily spot gold returns by calender month over the entire sample period, with one standard deviation daily variability ranges. September and November returns stand out as abnormal.

In summary, evidence from average daily returns supports a belief that gold returns are abnormally strong in September and November (especially September), with no other months exhibiting surprising strength or weakness.
Cautions regarding findings include:
- From an investor’s perspective, monthly returns and variabilities are more useful.
- More detailed modeling is important in translating average results into portfolio-level outcomes.
- Statistical significance tests assume reasonably tame return distributions. To the extent actual distributions are not tame, these tests (and the interpretations of average and standard deviation) break down.
Compare with findings in “Any Seasonality for Gold or Gold Miners?”, which uses monthly spot gold price over a longer sample period.