How and how well does mean-variance investing work? In his August 2012 draft book chapter entitled “Mean‐Variance Investing”, Andrew Ang compares outcomes for complex asset allocation strategies based on forecasted return statistics to those for very simple strategies such as equal weighting. He illustrates with a horse race among allocation strategies applied to four asset classes (U.S. government bonds, U.S. corporate bonds, U.S. stocks and international stocks), with portfolios reformed monthly based on return statistics estimated from five-year lagged rolling intervals and shorting constrained to no more than -100% for each asset. Using mathematical derivations and monthly return data for the example asset classes during 1973 through 2011, and contemporaneous one-month Treasury bill yields as the risk-free rate, he concludes that:
- The essential import of mean-variance investing is that diversification suppresses avoidable risks, thereby increasing return per unit of risk.
- Mean-variance optimization is highly sensitive to estimated asset return means, volatilities, and correlations. In other words, very small changes to these estimates generate extremely different portfolios. Investors can improve estimates by applying methods that suppress outliers, using large samples and incorporating economic models.
- Practitioners using mean-variance optimization generally impose constraints (for example, limiting leverage or shorting) to keep portfolio weights economically viable.
- Factor investing, which focuses on diversifying across risk factors (rather than asset classes), is important for maximizing the benefits of diversification.
- Simple diversification strategies tend to work much better than full mean-variance optimization. Equally weighting is one of the best performers, but any well-balanced, fixed-weight allocation strategy works reasonably well (see the table and chart below).
- Investors who can estimate asset return volatilities should consider risk parity. However, risk parity ignores valuations and accrues a mean reversion penalty if implemented with relatively short estimation intervals.
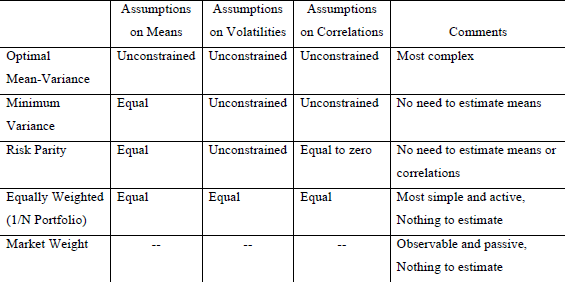
The following table, taken from the paper, summarizes the assumptions of several complex and simple diversification strategies with respect to the future means, volatilities and correlations of asset return series. The most complex strategy is mean-variance optimization, which requires forecasts of all three asset return statistics. The minimum variance strategy simplifies by assuming assets will have equal mean returns. Risk parity further simplifies by assuming asset returns are uncorrelated. Equal weighting and market weighting require no forecasts of asset return statistics.

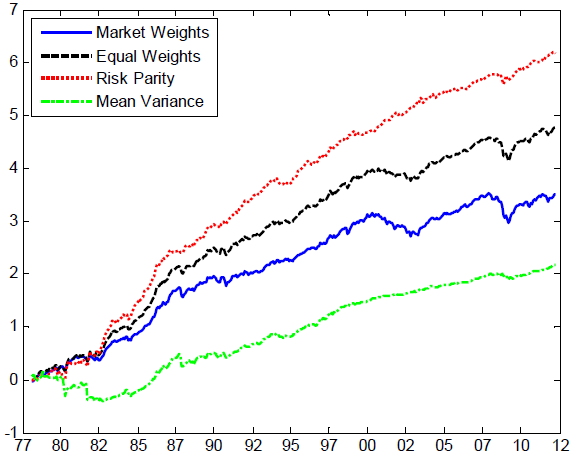
The following chart, also from the paper, compares cumulative returns of market weighting, equal weighting, risk parity and full-blown mean-variance optimization for the asset allocation horse race described above, with returns for the latter three leveraged to obtain the same volatility as passive market weighting. Equal weighting and risk parity perform well, while mean-variance optimization performs poorly. Annual gross Sharpe ratios for the four strategies are:
- Market weighting: 0.41
- Equal weighting: 0.54
- Risk parity (calculated from variances): 0.59
- Mean-variance optimization: 0.07
The gross Sharpe ratio for a strategy that allocates proportionally to lagged Sharpe ratio is 0.45, and that for risk parity calculated from realized volatilities rather than variances is 0.65 (neither shown on the chart).
Note that different allocation strategies may generate very different levels of portfolio turnover (and, in some cases, short positions). Accounting for trading frictions and shorting costs may affect horse race outcomes.

In summary, evidence indicates that simplified versions of mean-variance optimization outperform the full-blown strategy in guiding asset diversification because fewer things can go wrong with estimates of future asset return statistics. Simple equal weighting and risk parity perform well.
Cautions regarding findings include:
- As noted, findings derive from gross return analysis. Accounting for reasonable trading frictions and shorting costs, which vary considerably across assets and over time, may alter conclusions.
- Mean-variance optimization (and Sharpe ratio) derivations generally assume that asset return distributions are normal (not wild). Suppression of outliers in historical data helps tame return samples, but to some degree also disengages from reality.