Do changes in total market capitalization shares of large-capitalization and small-capitalization stocks predict future equity returns? In their September 2012 paper entitled “Davids, Goliaths, and Business Cycles”, Jefferson Duarte and Nishad Kapadia investigate whether a predictor based on concentration of market valuation predicts market returns. Specifically, they test the power of annual change in the logarithm of the fraction of total stock market capitalization captured by the largest 250 firms to predict future stock market returns. They call this indicator Goliaths Versus Davids (GVD). They compare the predictive power of GVD to those of eight other variables: (1) the default spread (difference between BAA and AAA corporate bond yields); (2) the term spread (difference between 10-year Treasury note and the 1-month Treasury bill yields); (3) the stock market dividend-price ratio; (4) the cyclically adjusted price-earnings ratio; (5) the consumption, wealth, income ratio; (6) the investment-to-capital ratio; (7) the book-to-market ratio of the Dow Jones Industrial Average; and, (8) the net payment yield of all stocks. Using quarterly data for a broad sample of U.S. common stocks and U.S. stock market returns during April 1926 through April 2011, they find that:
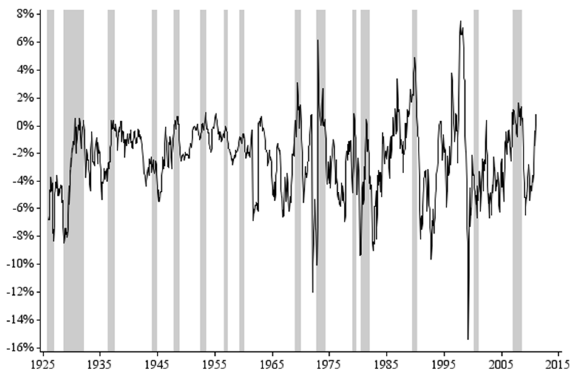
- GVD is significantly counter-cyclical, with the largest firms losing (gaining) market share during expansions (contractions). The correlation between GVD and quarterly GDP growth is -0.23.
- Based on in-sample testing over the entire sample period, GVD explains 3.3% (R-squared statistic 0.033) of next-quarter stock market returns. Over the first, middle and last thirds of the sample period, this explanatory power is 2.5%, 6.8% and 3.8%, respectively. Results are generally robust to forecast horizon, cut-off point for number of “Goliaths” and exclusion of unusual events (addition of exchanges to the source database, oil crisis and internet bubble).
- Based on out-of-sample testing over the past 35 years, lagged GVD outperforms all competing lagged variables in predicting quarterly stock market returns. The out-of-sample R-squared statistic for GVD versus future quarterly return ranges as high as 10.2% for GVD with 500 Goliaths during the subperiod since 1975.
- Regressions confirm that GVD offers forecasting power independent of that found in competing variables.
The following chart, taken from the paper, plots quarterly GVD over the entire sample period, with NBER economic contractions shaded grey. This chart shows that GVD tends to be negative (positive) during U.S. economic expansions (contractions). In other words, the share of total stock market capitalization captured by the top 250 firms tends to decrease (increase) during expansions (contractions). Outliers in 1962 and 1972 correspond to addition of AMEX and NASDAQ stocks, respectively, to the source database.

In summary, evidence indicates that the change in the level of concentration of total market capitalization in the largest firms may be a useful predictor of stock market returns.
Cautions regarding findings include:
- Explanatory power quantified by the R-squared statistic, whether in-sample or out-of-sample, does not obviously translate into a trading strategy (specifying GVD trading signal thresholds derived from strictly historical data) that reliably outperforms a buy-and-hold benchmark on a net basis.
- There is data snooping bias in identifying the number of Goliaths and the subperiod producing the highest predictive power.
For a related concept, see “Relative Strength of Indexes as a Future Return Indicator”.