“Market Capitalization Concentration as Stock Market Predictor” summarizes research finding that the change in the level of concentration of total market capitalization in the largest firms may be a useful predictor of stock market returns. Does a simple trading strategy based on this finding beat the market? To investigate, we examine the ratio of the S&P 500 Index (representing large stocks) and the Russell 2000 Index (representing small stocks). When the concentration of total market capitalization in large firms is high (low), this ratio is high (low). In concert with the referenced research, we derive trading signals from the lagged annual change in this index ratio. Using monthly levels of the S&P 500 Index, the Russell 2000 Index and the monthly yield on 13-week Treasury bills (T-bills) from inception of the Russell 2000 Index in September 1987 through September 2012, we find that:
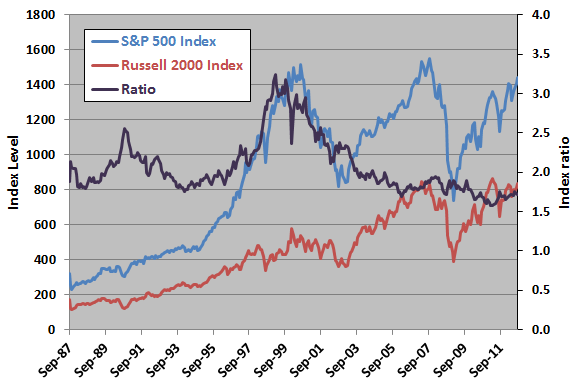
The following chart plots the S&P 500 Index, the Russell 2000 Index and the ratio of the former to the latter over the available sample period. The relationship between the index ratio and future S&P 500 Index behavior is not clear. Nor is there an obvious value of the index ratio to which it reverts.
For precision, we relate future S&P 500 Index return to lagged annual change in the index ratio.
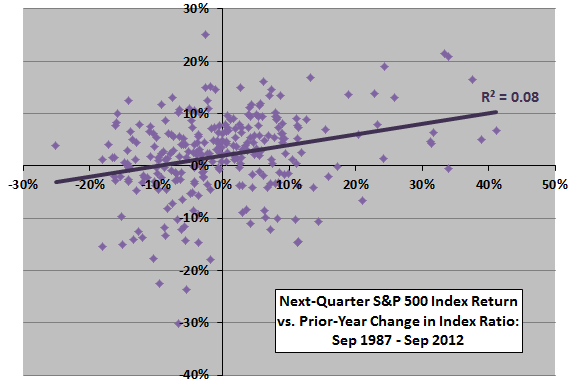
The following scatter plot relates, per the referenced research, next-quarter S&P 500 Index return to annual change in the index ratio over the available sample period. The Pearson correlation for the relationship is 0.28 and the R-squared statistic 0.08, indicating that the lagged annual change in the index ratio explains a potentially exploitable 8% of the variation in next-quarter return.
In case there is a material non-linearity in the relationship, we look at future return by range of annual change in the index ratio.
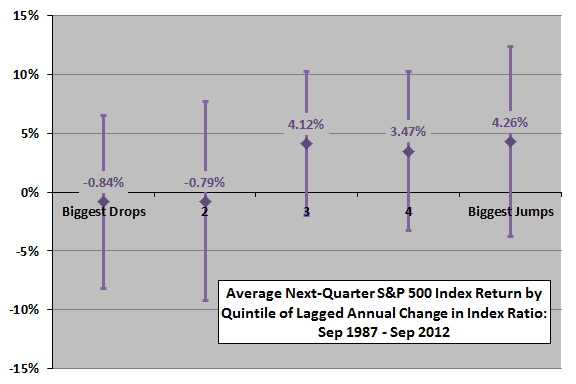
The next chart summarizes average next-quarter S&P 500 Index returns by ranked fifths (quintiles) of lagged annual change in the index ratio, with one standard deviation variability ranges, over the available sample period. While the variation in average returns across quintiles is not systematic, relatively large increases in the index ratio are better for future returns than are large decreases.
Since the observations for the preceding two charts derive from monthly data, there is considerable overlap in index ratio and S&P 500 Index future return measurement intervals which could distort statistics. Also, associated analyses are in-sample, potentially confounding exploitability.
What about a feasible trading strategy to exploit the relationship?
We consider a trading strategy as follows:
- Each month, when the prior-month lagged annual change in the ratio of the S&P 500 Index to the Russell 2000 Index is above (below) a specified threshold, switch to the S&P 500 Index (T-bills).
- Assume calculations just before the monthly close are good enough, so that switching is at the same close as signals.
- Consider thresholds of -2.5% to 15% for lagged annual change in the index ratio.
- Assume 0.2% switching friction, but ignore tax impacts of trading.
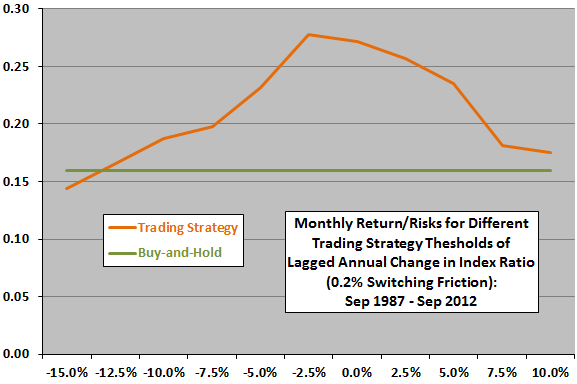
The next chart plots the ratio of gross monthly average return to standard deviation of returns (return/risk) for different trading strategy thresholds for lagged annual change in the index ratio over the available sample period. The risk-adjusted gross performance of the trading strategy is almost always better than that of a benchmark strategy of buying and holding the S&P 500 Index. The optimal threshold for lagged annual index ratio change is -2.5% (in stocks when the lagged annual change in the index ratio is greater than -2.5%).
For a different perspective, we look at terminal values of equal initial investments.
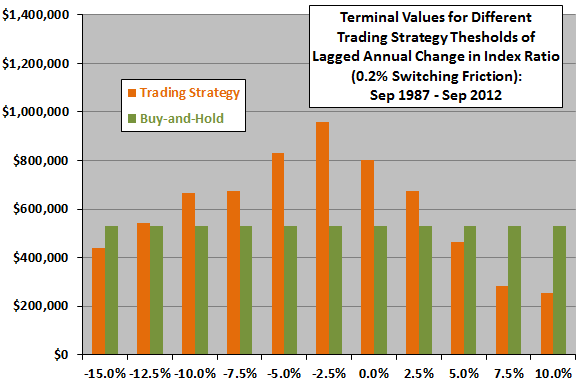
The final chart shows gross terminal values of $100,000 initial investments at the end of September 1988 in the trading strategy and a buy-and-hold benchmark for different trading strategy thresholds for lagged annual change in the index ratio over the available sample period. The trading strategy beats buy-and-hold for thresholds from -12.5% to 5.0%, with -2.5% again optimal.
The optimal threshold generates 39 switches, with breakeven trading friction a fairly high 1.7% per switch.
In summary, evidence from simple tests supports belief in the exploitability of market capitalization concentration as a stock market return predictor.
Cautions regarding findings include:
- The S&P 500 Index does not include dividends, probably to the disadvantage of the buy-and-hold benchmark.
- Given the 12-month calculation interval for change in index ratio, the sample period is not very long.
- The optimal trading strategy threshold entails data snooping bias (luck) from testing multiple thresholds on the same sample, thereby likely overstating its future performance.
- Some interval other than 12 months for calculation of the change in index ratio may work better.
- Some long-short strategy may work better, but would entail shorting costs and may invite additional snooping bias.