How can equity weighting strategies and their opposites both outperform the stock market? In the October 2012 version of their paper entitled “The Surprising ‘Alpha’ from Malkiel’s Monkey and Upside-down Strategies”, Rob Arnott, Jason Hsu, Vitali Kalesnik and Phil Tindall challenge beliefs underlying a variety of stock investment strategies that beat a capitalization-weighted benchmark by examining the performance of portfolios based on opposite beliefs. If the original beliefs determine success, then their opposites should underperform. They limit their investigation to long-only stock weightings based on original beliefs and opposites based on inverse weights or complement weights. To ensure portfolio feasibility, they restrict U.S. and global universes to large-capitalization stocks. They reform portfolios at the end of each year. When needed in portfolio construction, they estimate historical parameters (such as volatility) using five years of lagged monthly data. They consider capitalization-weighted, equal-weighted and diversity-weighted benchmarks and use a conventional four-factor (market, size, book-to-market and momentum) model to calculate strategy alphas. They ignore trading frictions. Using monthly returns for the top 1,000 U.S. stocks by market capitalization during 1964 through 2010 and for large-capitalization global stocks during 1991 through 2010, they find that:
- For U.S. stocks over the entire sample period, during which the capitalization-weighted gross annual Sharpe ratio is 0.28:
- Portfolios that overweight low-volatility, low-beta and low-downside semi-deviation outperform, with gross annual Sharpe ratios of 0.36, 0.34 and 0.37, respectively. However, portfolios that inversely overweight high-volatility, high-beta and high-downside semi-deviation generate gross annual Sharpe ratios of 0.46, 0.53 and 0.46, respectively. Key differences between risk-avoiding and risk-seeking strategies are that the former depend much more on the book-to-market factor but much less on the market factor (with no statistically significant four-factor alphas).
- Minimum variance and maximum diversity portfolios outperform, with gross annual Sharpe ratios of 0.53 (the highest found) and 0.47, respectively. However, inverse strategies that focus on companies with high return covariances also outperform, both with gross annual Sharpe ratio 0.41. Exposure to value and size factors explains most of the inverse outperformance (with no statistically significant four-factor alphas).
- Portfolios that overweight high book value, five-year average reported earnings, earnings growth and a composite of strong fundamentals outperform, with gross annual Sharpe ratios of 0.38, 0.37, 0.37 and 0.41, respectively. However, inverse strategies that focus on fundamentally “weak” companies mostly also outperform, with gross annual Sharpe ratios of 0.47, 0.50, 0.27 and 0.47. Exposure to value and size factors explains most of the inverse outperformance (sometimes also with statistically significant four-factor alphas).
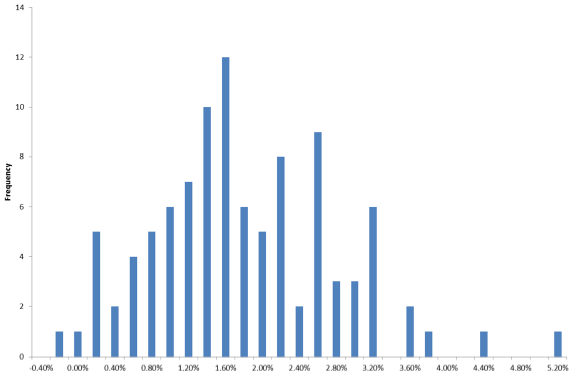
- 100 simulations of a dart-throwing monkey, each year randomly generating an equally weighted portfolio of 30 stocks from the U.S. large-capitalization universe, outperforms with an average gross annual Sharpe ratio of 0.32 (see the chart below). The four-factor model explains this outperformance with loadings identical to those for an equal-weighted portfolio of all 1,000 stocks.
- Across all tests, the original (inverse) strategies have an average gross annual Sharpe ratio of 0.39 (0.42).
- For the shorter global sample, all original strategies except one and all inverse strategies except one beat the capitalization-weighted benchmark. Inverse strategies beat their original counterparts in 73% of cases.
- In general, the tested investment beliefs and their inverses work because they produce, often unintentionally, favorable value and size tilts. Investors should therefore arguably focus on the least costly ways to achieve such tilts.
The following chart, taken from the paper, is a histogram of gross annual return outperformance relative to a capitalization-weighted benchmark for 100 simulations of a dart-throwing monkey. For each year of each simulation, the monkey randomly selects 30 stocks from the U.S. large-capitalization universe for an equally weighted portfolio. On average across all simulations, the monkey beats the benchmark by 1.69% per year. The monkey matches or beats the benchmark in 99 of 100 trials due to size (especially) and value portfolio tilts.

In summary, evidence indicates that many stock investment strategies that beat capitalization-weighted benchmarks do so simply because they disconnect stock prices and portfolio weights, thereby introducing value and size tilts.
Perhaps investment belief testing should routinely involve contests with both the null hypothesis, and the opposite hypothesis.
Cautions regarding findings include:
- Portfolio return estimates are gross, not net. While mitigated by infrequent (annual) portfolio reformation, trading frictions would reduce portfolio returns depending on specific strategy turnover. Trading frictions (transaction fees and bid-ask spreads) are quite high during parts of the U.S. sample period.
- Testing many different strategies on the same sample introduces data snooping bias, such that the best-performing strategies incorporate some luck unlikely to be experienced in new data.
- The four-factor model is specific to stocks.