Does the information in short, intermediate and long stock price trends combined by relating multiple simple moving averages (SMA) to future returns usefully predict stock returns? In the September 2015 update of their paper entitled “A Trend Factor: Any Economic Gains from Using Information over Investment Horizons?”, Yufeng Han and Guofu Zhou examine a trend factor that simultaneously captures short, intermediate and long stock price trends. Specifically, at the end of each month for each sampled stock, they:
- Calculate SMAs over the past 3, 5, 10, 20, 50, 100, 200, 400, 600, 800 and 1,000 trading days.
- Normalize SMAs by dividing by the final close.
- Regress monthly SMAs against next-month stock returns to estimate historical linear coefficients for all SMAs.
- Predict the return for the stock next month based on average SMA coefficients for the past 12 months applied to the most recent set of SMAs.
They define the trend factor as the average monthly gross return for a portfolio that is each month long (short) the equally weighted fifth (quintile) of stocks with the highest (lowest) expected returns. Using daily prices and associated stock/firm characteristics for a broad sample of U.S. common stocks during January 1926 through December 2014, they find that:
- Over the entire sample period:
- Gross average monthly trend factor return is 1.63%, compared to 0.79%, 0.79% and 0.34% for conventional short-term reversal, momentum and long-term reversion factors, respectively. Average monthly market return is 0.62%.
- Gross monthly trend factor Sharpe ratio is 0.47, compared to 0.23, 0.10 and 0.10 for short-term reversal, momentum factor long-term reversion factors. Monthly Sharpe ratio for the market is 0.12.
- While the momentum factor has pronounced negative skewness and high kurtosis, the trend factor has positive skewness and moderate kurtosis.
- Trend factor maximum drawdown is -20%, compared to -33%, -99% and -47% for short-term reversal, momentum and long-term reversion factors. Maximum drawdown for the market is -76%. The four worst monthly trend factor returns are -20.0%, -15.1%, -12.7% and -10.5%, compared to -89.7%, -83.2%, -60.0% and -55.7% for the momentum factor.
- Trend factor gross monthly three-factor (market, size and book-to-market) alpha is 1.54%, compared to 1.07% for the momentum factor.
- Gross average monthly return for the long (short) side of the trend factor is 1.93% (0.31%), compared to 1.81% (1.02%) for the conventional momentum factor.
- Average monthly trend factor portfolio turnover (breakeven trading friction) is 65.6% (1.24%), compared to 37.6% (0.68%) for the momentum factor.
- The trend factor is similarly exceptional during economic contractions. During the financial crisis (December 2007 through June 2009), gross monthly trend factor Sharpe ratio is 0.15, compared to -0.29 for both the momentum factor and the market.
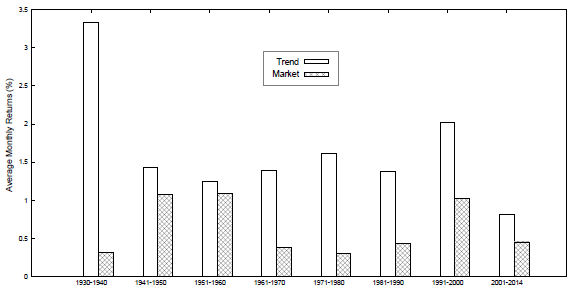
- The trend factor consistently outperforms the market by decade (see the chart below).
- The trend factor apparently emphasizes short-term price behaviors over intermediate-term and long-term behaviors. The trend factor performs better when information about stocks is uncertain, as indicated by high idiosyncratic volatility, high stock turnover, low analyst coverage and low firm age.
- Trend factor performance is robust to sample and factor construction details and to a variety of control variables.
The following chart, taken from the paper, compares gross average monthly trend factor and market returns over approximately eight decades (the first “decade” spans June 1930 through December 1940 and the last January 2000 through December 2014). Results show that, while trend factor gross outperformance is by far most pronounced during the turbulent 1930s, outperformance persists across all decades.
In summary, evidence indicates that a trend factor constructed by combining information from many simple moving averages of different lengths may usefully predict returns of U.S. stocks.
Cautions regarding findings include:
- Returns and alphas are gross, not net, and accounting for trading frictions and shorting costs would reduce reported values.
- Trend factor portfolio turnover is very high (about 66% per month), and trading frictions are large during parts of the sample period (see “Trading Frictions over the Long Run”).
- Shorting of stocks with the least favorable trend measurements may be costly or infeasible.
- The study does not account for costs of extensive data collection and computations (SMAs, regressions and extrapolations), or for the cost of a fund manager if delegated.
- It appears there is no time allowed for data collection and computations between data collection/computations and portfolio reformation based on outputs. Given the mass of calculations, this assumption is problematic. Inserting realistic delays may affect findings. The monthly data collection/computations may not have been possible in any reasonable time frame during the early part of the sample period (for example, during the 1930s, when the trend factor performs exceptionally well).