Does combining different portfolio performance enhancement concepts actually improve outcome? In their December 2012 paper entitled “Generalized Momentum and Flexible Asset Allocation (FAA): An Heuristic Approach”, Wouter Keller and Hugo van Putten investigate the effects of combining momentum, volatility and correlation selection criteria to form an equally weighted portfolio of the three best funds from a set of mutual fund proxies for seven asset classes, as follows:
- To follow trend, rank funds from highest to lowest lagged total return (relative momentum).
- To suppress volatility, rank funds from lowest to highest volatility (standard deviation of daily returns).
- To enhance diversification, rank funds from lowest to highest average pairwise correlation of daily returns.
- To avoid drawdown, replace with cash any selected fund that has a negative lagged return (intrinsic or absolute momentum).
Their seven asset class proxies are index mutual funds for U.S. stocks (VTSMX), developed market stocks outside the U.S. and Canada (FDIVX), emerging market stocks (VEIEX), mid-term U.S. Treasuries (VBMFX), short-term U.S. Treasuries (VFISX), commodities (QRAAX) and real estate (VGSIX). They use a default lagged measurement interval of four months for all four selection criteria. Their method of combining rankings for relative momentum, volatility and correlation is simple weighted average (with default weightings of 1, 0.5 and 0.5, respectively). They assume momentum calculations occur at the end of each month, with portfolio changes at the beginning of the next month. Using daily closing prices in U.S. dollars for the seven mutual funds from mid-1997 through mid-December 2012, they find that:
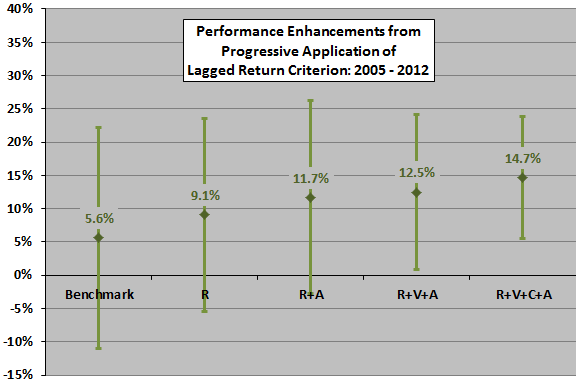
- During January 2005 through mid-December 2012 (see the chart below):
- An equally weighted, monthly rebalanced benchmark portfolio of all seven funds generates a gross annualized average return of 5.6%, with annualized volatility 16.6% (reward-to-risk 0.34).
- Applying relative momentum only to choose each month three winning funds generates an average annualized gross return of 9.1%, with annualized volatility 14.5% (reward-to-risk 0.63).
- Applying the absolute momentum criterion to replace relative momentum winners with cash (VFISX) when their lagged returns are negative limits drawdowns and generates an average annualized gross return of 11.7%, with annualized volatility 12.8% (reward-to-risk 0.92).
- Combining relative momentum and volatility, with volatility ranking given half the weight of return ranking, to select the top three funds and then applying the absolute momentum criterion generates an average annualized gross return of 12.5%, with annualized volatility 11.7% (reward-to-risk 1.07).
- Combining relative momentum, volatility and correlation, with the latter two rankings given half the weight of return ranking, to select the top three funds and then applying the absolute momentum criterion generates an average annualized gross return of 14.7%, with annualized volatility 9.2% (reward-to-risk 1.60).
- Adjusting the weights used to combine relative momentum, volatility and correlation rankings to optimize gross reward-to-risk ratio boosts its value to 1.76 (reducing average annualized gross return to 13.0%, but lowering annualized volatility to 7.4%).
- Breakeven fund switching friction for this optimized portfolio relative to the benchmark is 1.2% of value switched each month.
- Applying leverage to increase the volatility of this solution to approximately that of the S&P 500 Index and incorporating 0.1% one-way trading friction generates an average annualized net return of 22.6%, with annualized volatility 14.7% (reward-to-risk 1.54).
- During January 1998 through December 2004 (out-of-sample tests for robustness):
- An equally weighted, monthly rebalanced benchmark portfolio of all seven funds generates a gross annualized average return of 8.3%, with annualized volatility 9.8% (reward-to-risk 0.85).
- Combining relative momentum, volatility and correlation, with the latter two rankings given half the weight of return ranking, to select the top three funds and then applying the absolute momentum criterion generates an average annualized gross return of 13.4%, with annualized volatility 7.7% (reward-to-risk 1.73).
- For the final in-sample optimized and leveraged solution above, average annualized net return is 21.6%, with annualized volatility 14.5% (reward-to-risk 1.49).
- On a gross basis over the entire January 1998 through mid-December 2012 test period, the combined strategy beats the benchmark for lagged measurement intervals ranging from one to 12 months, with four months optimal. Results are generally robust to small variations in the number of funds selected, the lagged measurement interval and the weights used for combining relative momentum, volatility and correlation rankings.
The following chart, constructed from data in the paper, summarizes average annualized gross returns and volatilities for progressive addition of fund selection criteria during the January 2005 through mid-December 2012 subperiod. The benchmark is the equally weighted, monthly rebalanced portfolio of all seven mutual funds. The active allocations are equally weighted portfolios of the top three mutual funds based on: relative momentum only (R); relative momentum plus the absolute momentum criterion (R+A); combined relative momentum and volatility rankings, plus the absolute momentum criterion (R+V+A); and, combined relative momentum, volatility and correlation rankings, plus the absolute momentum criterion (R+V+C+A). Weights for volatility and correlation rankings are half that for relative momentum ranking.
Results indicate that each fund selection criterion adds value, though the value from volatility ranking is modest. Respective gross reward-to-risk ratios from left to right are 0.34, 0.63, 0.92, 1.07 and 1.60.
In summary, evidence indicates that a tactical asset class allocation strategy combining high relative momentum, low volatility, low correlation and absolute momentum all measured over the past few months easily outperforms passive diversification.
Cautions regarding findings include:
- As noted in the paper, parameter selections (top three funds, lagged measurement interval of four months, relative weights assigned to lagged return/volatility/correlation rankings) are empirical optimizations, subject to data snooping bias. Out-of-sample and robustness tests largely mitigate this concern.
- Results above and the simple empirical analyses in “Asset Class Diversification Effectiveness Factors” suggest that lagged volatilities of asset returns are unimportant compared to their lagged average returns and lagged average pairwise correlations.
- Costs and constraints for trading mutual funds (such as front-end loads, back-end loads, management fees and short-term trading restrictions) may differ from those for trading exchange-traded fund (ETF) alternatives. The switching friction tests in the paper are therefore notional.