Do analyst stock ratings usefully predict associated returns? In his November 2012 paper entitled “Are Stock Recommendations Useful”, Ireneus Stanislawek examines the relationship between stock ratings offered by sell-side analysts around the globe over the past decade and future stock returns. He defines an overall analyst rating ratio for a stock as the number of positive ratings minus the number of negative ratings, divided by the total number of ratings. He also considers the monthly change in this ratio for a stock, employing a lag to exclude the immediate impact of a rating change on stock price. Using monthly stock ratings and returns for MSCI World Index stocks (an average of 23,000 ratings per month) from the end of 2001 through mid-2012, he finds that:
- Over the entire sample period, 49%/39%/12% of all stock recommendations are positive/neutral/negative. The ratio of positive to negative ratings ranges from about 3 to about 7, and is generally lower (higher) during bear (bull) markets.
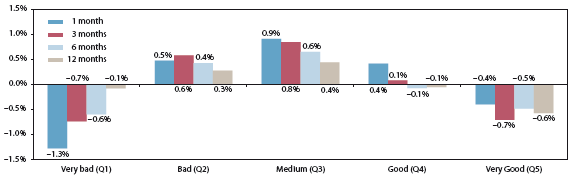
- For the entire sample, a portfolio consisting of the fifth of stocks with the best (worst) rating ratios, reformed monthly, underperforms the equally weighted average of all stocks by a gross annualized average of -0.4% (-1.3%). Stocks with middling rating ratios tend to outperform (see the first chart below). On a statistically rigorous basis, stock rating ratios do not predict future returns.
- Analysts tend to rate large capitalization stocks higher than small capitalization stocks, and rating ratios have different implications for large and small stocks (suggesting that analyst information about small stocks is more useful).
- A portfolio consisting of the largest third of stocks within the fifth of stocks with the best (worst) rating ratios, reformed monthly, underperforms (outperforms) all stocks by a gross annualized average of -1.4% (+0.7%).
- A portfolio consisting of the smallest third of stocks within the fifth of stocks with the best (worst) rating ratios, reformed monthly, underperforms all stocks by a gross annualized average of -0.1% (-2.4%).
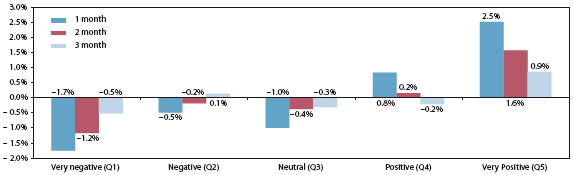
- Changes in rating ratios are more informative than the ratios themselves. A portfolio consisting of the fifth of stocks with the most positive (negative) monthly changes in rating ratio, reformed monthly, outperforms (underperforms) all stocks by a gross annualized average of +2.5% (-1.7%). These abnormal returns are statistically reliable, but diminish quickly for holding intervals longer than one month (see the second chart below).
The following chart, taken from the paper, summarizes gross annualized average abnormal returns (relative to all stocks in the sample) for quintiles of stocks ranked each month by analyst rating ratio and held for one, three, six or 12 months. Results show that the lowest and highest rated stocks both tend to underperform, while those with middling ratings tend to outperform. However, results do not exhibit statistical reliability.
The next chart, also from the paper, summarizes gross annualized average abnormal returns (relative to all stocks in the sample) for quintiles of stocks ranked each month by change in analyst rating ratio and held for one, two or three months. Results show that the most downgraded (upgraded) stocks tend to underperform (outperform) temporarily. For this metric, results are statistically reliable.
In summary, evidence indicates that sell-side analyst stock ratings over the past decade are essentially uninformative regarding future returns, but changes in ratings have some predictive power.
Cautions regarding findings include:
- Reported returns are gross, not net. Forming and maintaining portfolios of stocks with expected outperformance would incur trading frictions that would reduce and perhaps eliminate outperformance.
- Tests of statistical reliability assume that stock return distributions are tame. To the extent actual distributions are wild, these tests lose meaning.