Do Piotroski’s FSCORE for value stocks and Mohanram’s GSCORE for growth stocks predict winners and losers for non-U.S. stocks? In their March 2013 paper entitled “Fundamental Based Market Strategies”, Angelo Aspris, Nigel Finch, Sean Foley and Zachary Meyer apply previously documented fundamental (accounting-based) strategies to identify Australian stocks expected to outperform and underperform. Specifically, they consider FSCORE, GSCORE (sans advertising input due to lack of data) and RM-Index (combining a valuation assessment with measures of financial performance, creditworthiness, liquidity and operational efficiency). The FSCORE (GSCORE) ranking focuses on the fifth of stocks with the highest (lowest) book-to-market ratios, while the RM-Index ranking considers all stocks in the universe. Annual rescoring of stocks occurs at the beginning of the fifth month after financial year-ends to ensure public availability of data at the time of portfolio reformation. Using returns and fundamentals for S&P/ASX 300 firms during 2000 through 2010, they show that:
- All three sets of scores relate positively to future stock returns (see the chart below), thereby enabling strategies that generate gross outperformance relative to the market. A hedge strategy that buys (sells) the equally weighted top (bottom) two populated scores generates average gross annual returns of:
- 43.1% for FSCORE, with average gross market-adjusted contributions of 15.9% (27.2%) from the long (short) side. Stock selections concentrate in small and medium-size firms with relatively low liquidity (low annual stock turnover).
- 20.1% for GSCORE, with average gross market-adjusted contributions of 0.1% (20.0%) from the long (short) side. Stock selections concentrate in large firms with relatively high liquidity.
- 14.3% for RM-Index, with average gross market-adjusted contributions of 10.2% (4.1%) from the long (short) side. Stock selections concentrate in small and medium firms with relatively high liquidity.
- Based on regression analyses, a one point improvement in FSCORE/GSCORE/RM-Index indicates a 5.2%/3.0%/4.6% increase, respectively, in gross annual three-factor (market, size, book-to-market) alpha.
- The success of these scoring systems appears to derive from their abilities to predict future profitability (there are strong positive relationships between score and future return on assets).
- Findings are robust over time and to transaction costs.
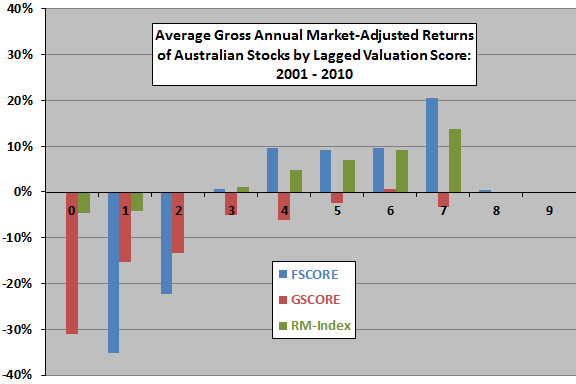
The following chart, constructed from data in the paper, summarizes average gross annual market-adjusted returns for equally weighted portfolios of Australian stocks sorted annually by FSCORE (scale 0 to 9), GSCORE (scale 0 to 7) and RM-Index (scale 0 to 7) during 2001 through 2010. Results indicate that:
- FSCORE and RM-Index identify both future winners and losers, while GSCORE identifies only losers.
- FSCORE discrimination between good and bad future performers is most pronounced, while RM-Index discrimination is most systematic.
Portfolio volatility generally decreases as GSCORE and RM-Index increase, but varies irregularly as FSCORE increases.
Note that the universe of stocks for FSCORE (GSCORE) consists only of the fifth of stocks with the highest (lowest) book-to-market ratios, such that the number of observations per score may be very low. In fact, there are no stocks in FSCORE ranks 0 and 9.
In summary, evidence indicates that fundamental analysis works at a gross level for a recent sample of Australian stocks.
Cautions regarding findings include:
- The paper does not provide detailed specifications for the RM-Index scoring system.
- The sample period is very short for annually reformed portfolios, especially for FSCORE/GSCORE, extreme valuation scores and subperiods.
- The universe of stocks is relatively small (perhaps especially in terms of industry diversification).
- Reported returns are gross, not net. Including reasonable trading frictions would reduce these returns. The paper does not quantify assertions that findings are robust over time or to transactions costs.
- Hedge portfolio returns do not account for cost/feasibility of shorting. Stock borrowing costs would reduce these returns, and some stocks may not be available for borrowing as needed.
- The study does not account for costs of data collection/processing (or a management fee if delegated).
For summaries of seminal FSCORE and GSCORE papers, see “Piotroski’s Efficient Value Investing” and “Mohanram’s Efficient Growth Investing”, respectively. For extensions of these strategies, see “Concentrating the Value Premium and Momentum with FSCORE” and “Amplifying Momentum with Volume and Accounting Indicators”.