Do investors efficiently process the information in extreme quarterly earnings? In their November 2009 paper entitled “Post Loss/Profit Announcement Drift”, Karthik Balakrishnan, Eli Bartov and Lucile Faurel examine whether investors fully price the implications of current quarterly losses/profits for future losses/profits. They consider three alternative definitions for profit/loss, all scaled by beginning-of-quarter total assets: (1) earnings before extraordinary items and discontinued operations; (2) earnings before extraordinary items, discontinued operations and special items; and, (3) net income. Using stock return, financial and risk adjustment data for a broad sample of 15,143 distinct firms (458,693 firm-quarters) over the period 1976-2005 (120 quarters), they conclude that:
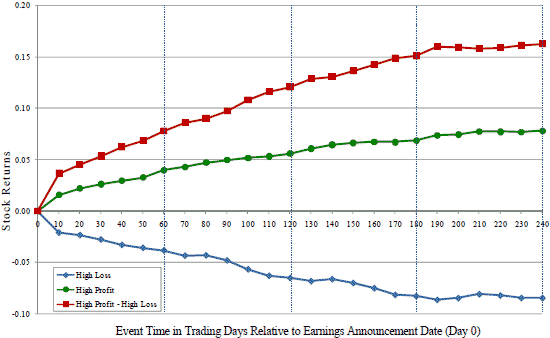
- During the 120 trading days after earnings announcement day, the 10% of firms with the worst (best) quarterly earnings generate an average gross size-adjusted return of of about -6% (+4%). A hedge portfolio that is a short the former and long the latter generates an average annualized gross abnormal return of about 21%. (See the chart below.)
- This abnormal return is larger than, and incremental to, those documented for post-earnings announcement drift, the book-to-market (value) and accruals anomalies.
- The effect is robust to size-adjustment, four-factor (market, size, value and momentum) adjustment, up and down markets, distress (bankruptcy) risk, short-sale constraints and transaction costs.
- Results hold for the entire 30-year sample period and for the 1976-1985, 1986-1995 and 1996-2005 subperiods.
- The fewer the analysts following a stock, the larger the average return from the strategy.
- Results apparently relate to systematic investor underestimation of the degree to which extreme returns will persist rather than revert in the next quarter.
The following chart, taken from the paper, compares the average cumulative size-adjusted abnormal returns during 1976-2005 for the 240 trading days after earnings announcement date for: (1) the 10% of firms with the worst quarterly earnings (High Loss); (2) the 10% of firms with the best quarterly earnings (High Profit); and, (3) a hedge portfolio that is short the former and long the latter (High Profit – High Loss). Earnings are before extraordinary items and discontinued operations, scaled by beginning-of-quarter total assets. The figure shows that daily abnormal returns diminish over time, with about 70% occurring in the first 120 trading days for (High Profit – High Loss).

In summary, evidence indicates that investors may be able to generate substantial average gross abnormal returns by systematically taking short (long) positions in stocks of firms with extremely bad (good) quarterly earnings for several months after respective earnings announcements.
Cautions regarding findings include:
- Returns are gross, not net. Accounting for trading frictions and shorting costs would reduce returns. Effects may be strongest among stocks that are most costly to trade (illiquid) and short (hard to borrow).
- Results at the portfolio level would involve capital management (cash reserves) to address a varying number of extreme earnings surprise opportunities over time.