Is there a way to optimize dynamically the degree of leverage for an investment? In his November 2009 paper entitled “On the Performance of Leveraged and Optimally Leveraged Investment Funds”, Guido Giese derives a general model for leveraged multi-asset investment strategies with daily re-balancing applicable to leveraged long and short Exchange-Traded Funds (ETF) and leveraged carry trades. Using daily data for the Dow Jones EURO STOXX 50 Index, the Dow Jones EURO STOXX 50 Volatility Index (VSTOXX) and the Euro OverNight Index Average (EONIA) rate from end of 1991 through May 2009, he concludes that:
- For a leveraged investment strategy with daily rebalancing, the optimal leverage factor for a given period depends on average values for the asset price growth rate, asset price volatility, interest rate (leverage financing cost) and asset borrowing rate (for shorting).
- Optimization is a trade-off between leveraged returns (varying linearly with the leverage factor) and volatility losses (growing quadratically with the leverage factor).
- The optimal leverage factor therefore depends strongly on market conditions (high during booming markets and low during turbulent markets).
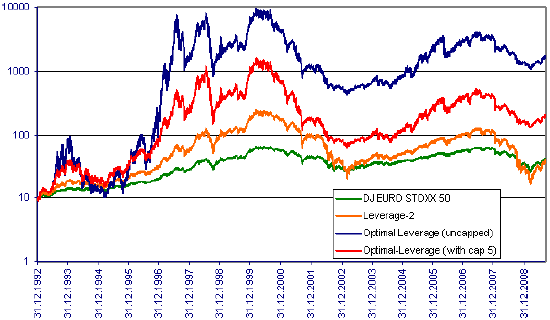
The following chart compares the cumulative performances of two optimally leveraged strategies (with and without a cap of five), a fixed leverage factor of two and the underlying DJ EURO STOXX 50 index over the entire sample period. The optimal leverage factor resets monthly based on:
- The annualized inception-to-date return of the index as the expected asset price growth rate.
- The implied volatility of the index as available since 1999 (and historical volatility before then) as the expected asset price volatility.
- The EONIA rate as the expected interest rate (leverage financing cost).
The capped leverage factor alternative recognizes limits on investor risk appetite and credit.
The strategy with a constant leverage factor of two has approximately the same long-term performance as the underlying index, meaning that volatility losses roughly offset leveraged returns. The optimally leveraged strategies, with or without a cap, outperform the underlying index because they tend to use a high leverage factor during bull markets and a reduced leverage factor during turbulent markets. The optimal strategies perform especially well during the mid-1990s when the market rallies with low volatility.
It appears that all of the leveraged strategies underperform the underlying index over the past decade. In other words, the mid-1990s subperiod drives the overall outperformance of the optimally leveraged strategies.

In summary, evidence from a limited sample period (in terms of number of bull and bear markets) indicates that optimized leverage beats both fixed leverage and no leverage. However, with unlucky initial conditions, even optimized leverage may underperform no leverage over a period of many years.