Is there a portfolio diversification approach that beats widely used mean-variance optimization and risk parity approaches? In their July 2011 paper entitled “Properties of the Most Diversified Portfolio”, Yves Choueifaty, Tristan Froidure and Julien Reynier compare the performance metrics of their Most Diversified Portfolio (MDP) to those of portfolios based on market capitalization (MKT), equal weight (EW), equal risk contribution (ERC) and minimum variance (MV). They define MDP for a given set of assets as the long-only portfolio with the maximum diversification ratio (weighted average portfolio component volatility divided by aggregate portfolio volatility). They constrain all competing portfolios to be fully invested, long only and unleveraged. For empirical testing, they reform all portfolios semi-annually from the top half of stocks the MSCI World Index by market capitalization. They use a one-year rolling historical window of daily returns to estimate asset volatilities and pairwise correlations as inputs for the MV, ERC and MDP allocations. Using daily and monthly returns for the specified MSCI World Index stocks and contemporaneous monthly Fama-French risk factors (market, size and book-to-market ratio) during 1999 through 2010, they find that:
- MKT generates a 2.9% gross annualized return, much lower than those for EW, ERC, MV and MDP (5.8%, 6.3%, 6.7% and 7.9%, respectively). The outperformance of these latter portfolios survives 2% trading frictions.
- Based on monthly returns, EW has about the same annualized volatility as MKT (16.7% versus 16.3%), while ERC, MV and MDP have markedly lower volatilities (13.1%, 10.0% and 11.1%, respectively).
- Based on monthly returns, annualized gross Sharpe ratios range from -0.01 for MKT to 0.42 for MDP, with EW second lowest and MV second highest.
- Diversification ratios range from 2.2 for MKT to 3.7 for MDP, with EW again second lowest and MV again second highest.
- Average annual portfolio turnover is much higher for ERC, MV and MDP (50% to 82%) than for MKT and EW (23% and 29%), indicating higher portfolio maintenance costs.
- All non-MKT allocations tilt toward small stocks, most notably EW and ERC. All also exhibit some tilt toward high book-to-market ratio stocks, most notably MV. Except for EW, market betas are well below 1.0, with MV lowest at 0.46. Gross annualized compound three-factor alphas for EW, ERC, MV and MDP are 0.04% , 0.14%, 1.35% and 2.26%, respectively.
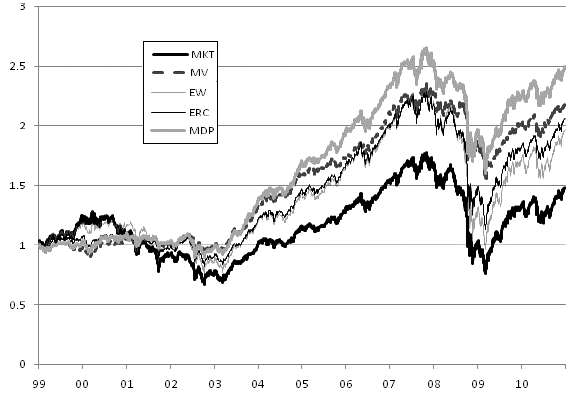
The following chart, taken from the paper, compares gross cumulative performances of five fully invested, long-only, unleveraged, semi-annually rebalanced asset allocation strategies applied to the top half of stocks by market capitalization in the MSCI World Index:
- Market capitalization weighting (MKT).
- Minimum Variance (MV), minimizing the expected portfolio volatility (the left-most portfolio on the mean-variance efficient frontier, with a 1.5% maximum asset weight, a time zone maximum weight and a turnover penalty.
- Equal Weight (EW).
- Equal Risk Contribution (ERC), equalizing the expected volatility contribution from each component asset to portfolio volatility.
- Most Diversified Portfolio (MDP), as defined above, with a 1.5% maximum asset weight, a time zone maximum weight and a turnover penalty.
Results show that all other allocation strategies outperform MKT, with MDP offering the highest gross terminal value. However, all portfolios exhibit large drawdowns during 2008.
In summary, evidence indicates that allocation strategies that seek to suppress portfolio-level volatility, led by the Most Diversified Portfolio, outperform market capitalization and equal weighting on a gross basis during the 2000s.
Cautions regarding findings include:
- The sample period is short in terms of number/mix of bull and bear equity market states and may not be representative of longer samples. See “Basic Equity Return Statistics”, which suggests that the sample period used is unusual. See also “The 2000s: A Market Timer’s Decade?”, results of which imply that the performance of randomly weighted portfolios would be instructive, as done in “Performance and Risk of Equity Strategy Indexes”.
- The relatively high turnover of portfolios weighted based on volatility (ERC, MV and MDP) indicate high trading frictions that offset some of their gross performance edges over MKT and EW.
- The study does not account for any costs of semi-annual data collection, programming and computation for the complex allocation strategies (or management fee, if delegated).
- There may be data snooping bias in selection of the special MV and MDP constraints (1.5% maximum asset weight, time zone maximum weight and turnover penalty).