Can investors use aggregate pairwise return correlations across asset classes to identify and exploit financial market regimes? In the April 2013 draft of their paper entitled “Handling Risk On/Risk Off Dynamics with Correlation Regimes and Correlation Networks”, Jochen Papenbrock and Peter Schwendner describe an approach for discovering market regimes based on pairwise correlations across 25 series of futures contracts spanning four asset classes. Each month, they calculate the set of pairwise correlations for these series based on daily returns and assign the resulting correlation structure to one of five regimes. They then look at the data within each regime to count the number of distinct groups of assets based on correlation clustering, with the potential that investors could view clusters as de facto asset classes. Using daily returns for 25 series of rolling futures contracts (six government bonds, seven equity indexes, six commodities and six currency exchange rates) during July 1998 through January 2013 to generate 175 sets of 25×25 monthly correlation matrices, they find that:
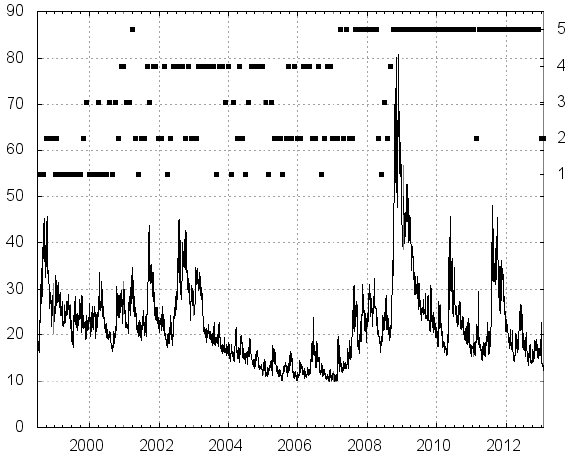
- Four of the five distinct correlation regimes appear before the 2008 Lehman Brothers bankruptcy, but only two appear afterwards. Based on an overlay of these regimes with the S&P 500 option-implied volatility index (VIX), two correlation regimes relate to a strong and three relate to a weak U.S. stock market (see the chart below).
- The average absolute pairwise correlation is much higher for the dominant post-Lehman regime than for the other four regimes.
- Within the five regimes, clustering of correlations indicates that:
- Three regimes consist of eight to nine distinct asset groups (suggesting an asset class diversification allocation paradigm).
- Two regimes, including the dominant post-Lehman regime, consist of only two distinct asset groups (suggesting a binary risk-on/risk-off allocation paradigm).
The following chart, taken from the paper, overlays a graph of VIX (left-hand vertical axis) and monthly observations of the five asset class correlation regimes (right-hand vertical axis, with each square representing one month) over the available sample period. Before the Lehman Brothers bankruptcy, the monthly correlation matrix shifts irregularly among regimes 1-4 (average absolute pairwise correlation less than 0.2). After the bankruptcy, regime 5 dominates (average absolute pairwise correlation greater than 0.3). The highest (lowest) returns are in regime 5 (1).
In summary, evidence indicates that asset class return correlations vary considerably over time across five regimes, with the currently dominant regime consisting of two de facto groups of asset classes (one risk-on and one risk-off).
Cautions regarding findings include:
- The study does not test any investment strategies based on correlation regimes/clustering.
- The methods applied involve considerable data and complex computations, inaccessible to many investors (or potentially costly if delegated).
- Results illustrate the difficulty of developing correlation predictions for asset allocation.
For less ambitious implementations, see “Stock Return Correlations and Equity Market Stress” and “Exploiting Stock Index Correlation”.