A subscriber inquired about the TransDow trading strategy, which seeks to exploit a relationship between the Dow Jones Transportation Average (DJTA) and the Dow Jones Industrial Average (DJIA). Specifically, this strategy:
- Computes the 10-week simple moving average (SMA) of the ratio of the weekly closes of DJTA to DJIA.
- Enters (exits) a long position in a risky asset, such as iShares Dow Jones Transportation Average (IYT), whenever the ratio crosses above (below) the SMA,
- Includes a stop-loss of -4% for any week, requiring a fresh signal for re-entry (the ratio crossing below the SMA and then crossing above it again).
The strategy creator finds that this strategy works well over a very long sample period based on indexes. However: (1) development of the strategy may impound data snooping bias; (2) the sample appears to have a lucky start for the strategy (just before the 1929 crash); and, (3) the testing methodology appears to ignore trading frictions (both from weekly signals and from transforming an index into a tradable asset), dividends and return on cash. Using weekly closes for DJTA and DJIA since November 2003 and for IYT (dividend-adjusted) since inception in January 2004, all through April 2013 (485-492 weeks), we find that:
Testing assumptions include:
- We can accurately estimate signals just before the close and implement them at the same close.
- One-way trading frictions range from 0.0% to 0.5% of portfolio value (but dividend reinvestment is frictionless).
- Return on cash is the contemporaneous yield on 3-month U.S. Treasury bills.
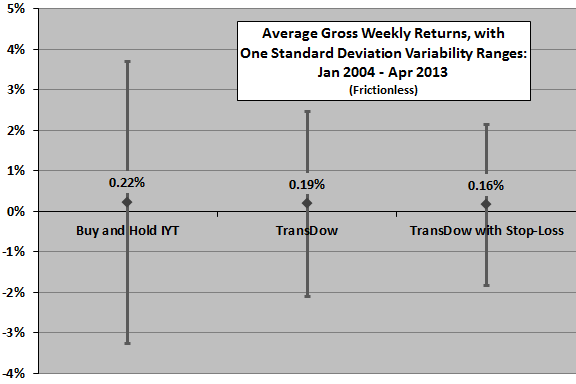
The following chart summarizes average gross (frictionless) weekly return statistics for buying and holding IYT, and for the TransDow strategy without and with the stop-loss adjunct. Gross weekly reward-risk ratios (average return divided by standard deviation of returns) are 0.06, 0.08 and 0.08 for buy-and-hold, TransDow and TransDow with Stop-Loss.
Without (with) the stop-loss rule, the TransDow strategy is in IYT 61% (49%) of the time. The average gross weekly return for IYT when TransDow:
- Without stop-loss is in stocks (cash) is 0.29% (0.12%), with standard deviation of weekly returns 2.93% (4.20%).
- With stop-loss is in stocks (cash) is 0.30% (0.15%), with standard deviation of weekly returns 2.84% (4.01%).
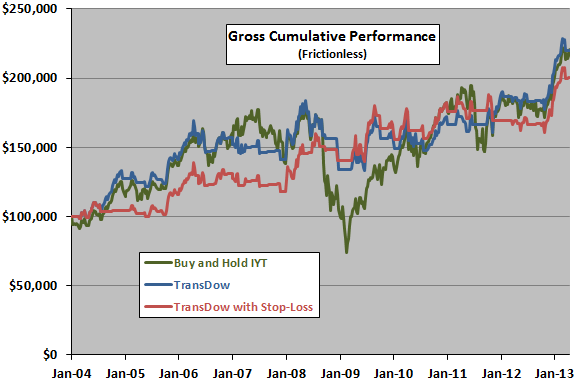
How do these statistics translate into cumulative performance?
The next chart tracks gross cumulative values of $100,000 initial investments in the three alternatives over the available sample period. Terminal values for buy-and-hold and TransDow without the stop-loss rule are practically the same, but the TransDow strategy avoids most of the crash during the financial crisis.
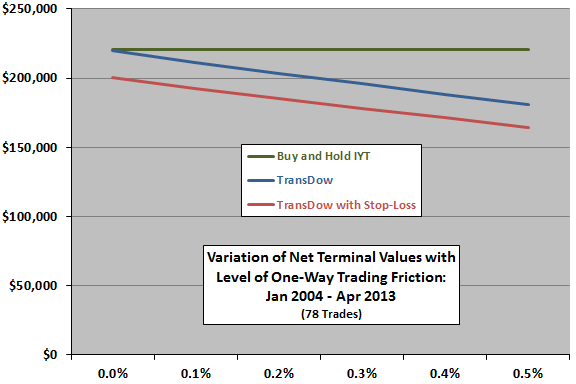
How do trading frictions (transaction fee plus bid-ask spread) affect TransDow strategy performance?
The final chart summarizes the effects on the above terminal values of varying the level of one-way trading friction from 0.0% to 0.5% of portfolio balance for the 78 trades generated by the TransDow strategy. The stop-loss rule triggers 25 exits, some of which are also exits without the rule. In general, effects of trading frictions are material (especially for investors with small accounts).
Trading frictions reduce average weekly returns for the TransDow strategy. For example, setting trading friction at 0.25% of portfolio value reduces the average weekly return for TransDow without (with) the stop-loss rule from 0.19% (0.16%) to 0.17% (0.14%).
In summary, evidence from simple tests suggests that the TransDow strategy may be attractive to investors who focus on volatility suppression and can achieve low trading frictions.
Cautions regarding findings include:
- Sample size is modest in terms of number of independent 10-week measurement intervals (about 50).
- To the extent any attractiveness of the TransDow strategy depends on sidestepping market crashes, the sample is very small (one crash).