Can investors rely on commodities to protect against inflation? In their May 2013 paper entitled “Commodities as Inflation Protection”, Andrew Marks, George Crawford and Jim Kyung-Soo Liew examine the belief that commodities represent an intrinsic store of value that hedges against inflation. They use spot prices for commodities because these prices have long histories. They use the U.S. Consumer Price Index (CPI) as the measure of inflation. However, CPI is an aggregate of the prices of many finished goods and services adjusted to reflect a government model of the actual cost of living, so it may not be possible to create a portfolio that tracks its composition. Commodities (such as crops, crude oil and precious metals), as raw inputs to these goods and services, may rise in price with the CPI, and the proliferation of futures contracts and related exchange-traded funds (ETF) makes investing in commodities accessible. Using monthly spot prices for 45 individual commodities and 14 aggregating indexes during January 1960 through December 2012 (53 years), with focus on five subperiods involving relatively high inflation, they find that:
- Over the entire sample period:
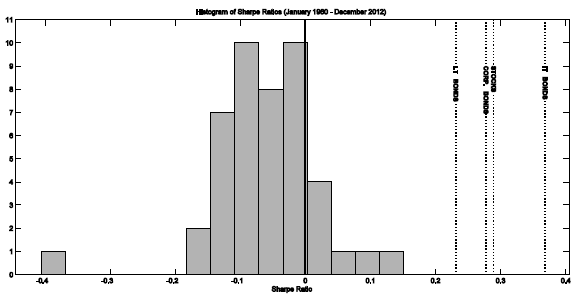
- The total return for the S&P 500 Index has a gross annualized return of 9.7% (5.5%), outperforming all 59 commodities/commodity indexes. Stocks, long-term U.S. Treasuries, intermediate-term U.S. Treasuries and corporate bonds all have gross annual Sharpe ratios at least double those of all 45 individual commodities except gold (see the chart below).
- Only about a third of the 45 individual commodities and three of 14 commodity indexes (energy, fertilizers and metals/minerals) beat inflation. Only seven commodities (crude oil, gold, silver, natural gas, platinum, potash and phosphate rock) and one commodity index (energy) outperform U.S. Treasury bills (T-bills).
- In general, commodities tend to perform better during high-inflation subperiods than over the entire sample period.
- However, many individual commodities perform inconsistently across such subperiods, with some of the best in one becoming the worst in another. Silver is the most consistent individual commodity, generating positive real returns in all high-inflation subperiods except the short inflationary burst of 1989-1990.
- During some such subperiods, many individual commodities outperform stocks. For example, during June 1967 through December 1982, 12 of 45 individual commodities outperform stocks. Crude oil, natural gas, gold and silver beat inflation by an annualized 14.2%, 11.6%, 9.8% and 6.7%, respectively, during this subperiod. However, during the inflationary burst of 1989-1990, gold and silver perform poorly.
- The energy index is the only one of the 59 commodities/commodity indexes that earns positive gross real returns in every subperiod (and a 4.0% annualized gross real return during 1960-2012).
- Precious metal prices tend to spike (crash) as inflation accelerates (decelerates, though still high).
- Commodity returns are largely uncorrelated with stock returns, offering potentially useful diversification.
- Over the entire sample period, returns for 34 commodities have absolute correlations with S&P 500 Index returns less than 0.05. Only one of 14 commodity indexes has a correlation with stock returns as high as 0.10.
- However, correlations vary considerably across subperiods.
- An equally weighted index of all 45 commodities, rebalanced monthly, generates an annualized gross nominal (real) return of 6.7% (2.6%) over the entire sample period. The standard deviation of annual nominal returns is 8.5%, with Sharpe ratio 0.18. It has only one large drawdown (2008). However, it underperforms inflation during 1967-1970, 1977-1982 and 1989-1991.
The following chart, taken from the paper, is a histogram of annualized gross Sharpe ratios for 45 individual commodities during 1960-2012, showing that most commodities underperform the risk-free rate (T-bill yield). Based on Sharpe ratio, stocks, long-term U.S. Treasuries, intermediate-term U.S. Treasuries and corporate bonds outperform all commodities. Investing in commodities therefore arguably involves an opportunity cost. The top three commodity Sharpe ratios belong to gold, silver and platinum (annualized gross real returns of 3.5%, 2.8% and 1.7%, respectively).
In summary, evidence indicates that commodities are generally not reliable inflation hedges, with successful hedging contingent on picking the right commodities and good market timing.
Cautions regarding findings include:
- As noted in the paper, the use of spot prices implies holding actual commodities, but the study ignores associated management, transportation, storage, spoilage and transaction costs.
- As also noted in the paper, returns on commodity futures contracts may exceed those for spot prices, but futures prices are not available over much of the sample period (including the subperiods with highest inflation).
- Using ETFs to invest in commodities impounds trading frictions for underlying futures contracts, plus fund management and administrative fees.
See also the closely related “Commodities as an Inflation Hedge”.