Are there worldwide anomalies with regard to equity market returns by calendar month? In his June 2013 paper entitled “Stock Market Performance: High and Low Months”, Vichet Sum examines stock market performance in 70 countries to determine which months generate relatively high and low returns. He weights country stock markets equally in calculating worldwide statistics. Using monthly returns as available (with many series beginning in the 1980s and 1990s) mostly through May 2012, he finds that:
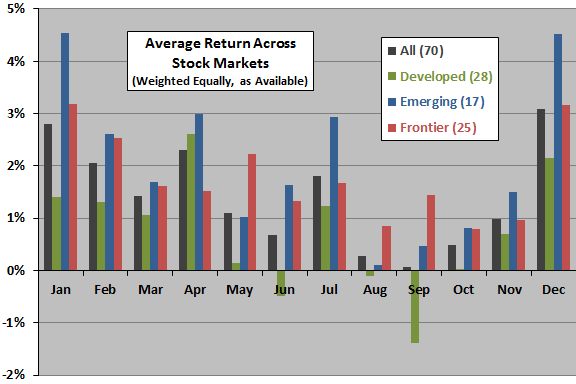
- Average returns are highest in December, January and April. February and July are also above average. About 26% / 24% / 14% of countries have their highest mean return in January / April /December, respectively.
- Average return is lowest for September, with (in ascending order) August, October and June also notably low.
The following chart, constructed from data in the paper, summarizes average return by calendar month for equal weighting of all 70 country stock market, 28 developed markets, 17 emerging markets and 25 frontier markets. The average monthly return across all months is 1.4% (equally weighting the country markets). For developed markets, April and December are clear winners, and September is a clear loser. For emerging and frontier markets, January and December are clear winners, and August is weakest.
Due to data availability, subsamples address somewhat different sample periods.
In summary, evidence suggests some differences in worldwide equity market returns by calendar month, with differences varying across developed, emerging and frontier markets.
Cautions regarding findings include:
- For most countries, the sample period is only 20 to 30 years, and statistical significance tests appear not to take into account correlations of returns across countries (effectively reducing sample size).
- As noted, aggregate statistics do not take into account country market sizes.
- The paper offers no tests of strategies to exploit findings.
- Findings for other asset classes may be different.
Compare and contrast with “Three Centuries of Calendar Effects”.