What initial retirement portfolio withdrawal rate is sustainable over long horizons when, as currently, bond yields are well below and stock market valuations well above historical averages? In their June 2013 paper entitled “Asset Valuations and Safe Portfolio Withdrawal Rates”, David Blanchett, Michael Finke and Wade Pfau apply predictions of bond yields and stock market returns to estimate whether various initial withdrawal rates succeed over different retirement periods. They define initial withdrawal rate as a percentage of portfolio balance at retirement, escalated by inflation each year thereafter. They simulate future bond yield as a linear function of current bond yield with noise, assuming a long-term average of 5% and bounds of 1% and 10%. They simulate future U.S. stock mark return as a linear function of Cyclically Adjusted Price-to-Earnings ratio (CAPE, or P/E10), the ratio of current stock market level to average earnings over the last ten years, assuming P/E10 has a long-term average of 16.4 with noise (implying average annual return 10% with standard deviation 20%). They simulate inflation as a function of bond yield, change in bond yield, P/E10 and change in P/E10 with noise. They assume an annual portfolio management fee of 0.5%. They run 10,000 Monte Carlo simulations for each of many initial withdrawal rate scenarios, with probability of success defined as the percentage of runs not exhausting the portfolio before the end of a specified retirement period. Using initial conditions of a government bond yield of 2% and a P/E10 of 22 as of mid-April 2013, they find that:
- Based on data since 1926, current U.S. government bond yield explains 92% of the variation in 10-year future U.S. government bond total return.
- Based on data since 1871, current P/E10 explains 24% (6%) of the variation in 10-year (one-year) future U.S. stock market return.
- Based on the simulation approach described above, the probability of success for a specific initial retirement portfolio withdrawal rate varies considerably with equity allocation, initial bond yield and initial P/E10.
- Very few scenarios for these three variables offer a greater than 90% probability of success for a 4% initial withdrawal rate over a 30-year period.
- For an equity allocation of 40%, a bond yield of 2% and a P/E10 of 22, the probability of success for an initial withdrawal rate of 4% over a 30-year period is only 48%.
The following set of tables, taken from the paper, summarizes maximum safe initial withdrawal rates for various equity allocations, retirement periods and probabilities of success assuming an initial bond yield of 2.0% and an initial P/E10 of 22. A 4% initial withdrawal rate is not safe for most scenarios.
The reciprocal of initial withdrawal rate indicates the amount an individual must save to achieve an income goal. For example, a 4% initial withdrawal rate indicates that initial portfolio value must be 25 times target annual income at retirement.
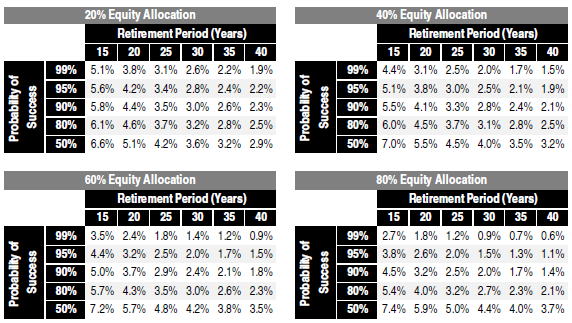
In summary, evidence suggests that current financial conditions make the conventional 4% initial withdrawal rate unsustainable for most retirement scenarios.
Cautions regarding findings include:
- The study cites evidence of bond yield and stock market return predictability based largely on 10-year future returns (and 10-year lagged earnings for P/E10). Supporting samples are not large in terms of independent 10-year measurement intervals.
- Moreover, the measurements of predictive power are in-sample. An investor operating in real time during the sample period would have experienced statistics different from those used in the study’s simulations. See “P/E10 and Future Stock Market Returns” for tests of out-of-sample usefulness of P/E10 as a stock market predictor.