Some experts interpret stock market return volatility as an indicator of investor sentiment, with high (low) volatility indicating ascendancy of fear (greed). Volatility of volatility (VoV) would thus indicate uncertainty in investor sentiment. Does the risk associated with this uncertainty depress stock prices and thereby predict relatively high future stock market returns? To investigate, we consider two measures of U.S. stock market volatility: (1) realized volatility, calculated as the standard deviation of daily S&P 500 Index return over the last 21 trading days (annualized); and, (2) implied volatility as measured by the Chicago Board Options Exchange Market Volatility Index (VIX). For both, we calculate VoV as the standard deviation of volatility over the past 21 trading days and test the ability of VoV to predict SPDR S&P 500 (SPY) returns. To avoid overlap in volatility and VoV calculations, we focus on monthly return intervals. Using daily values of the S&P 500 Index since December 1989 and VIX since inception in January 1990, and monthly dividend-adjusted SPY closes since inception in January 1993, all through July 2013, we find that:
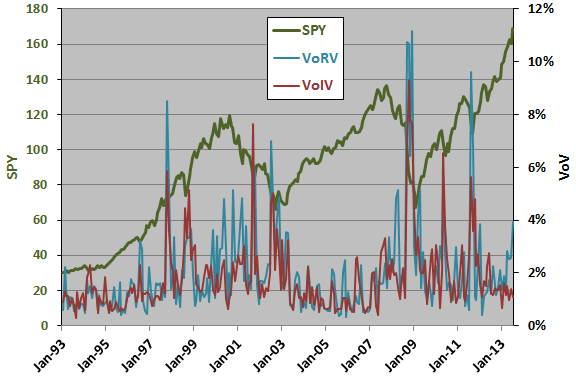
The following chart shows the evolutions of SPY, volatility of realized volatility (VoRV) and volatility of VIX (VoIV) over the available common sample period based on monthly data. It appears that VoV often spikes during market declines, but the magnitude of spikes varies. Also, there are differences in the behaviors of VoRV and VoIV.
For precision, we relate SPY returns to VoV for various lead-lag relationships.
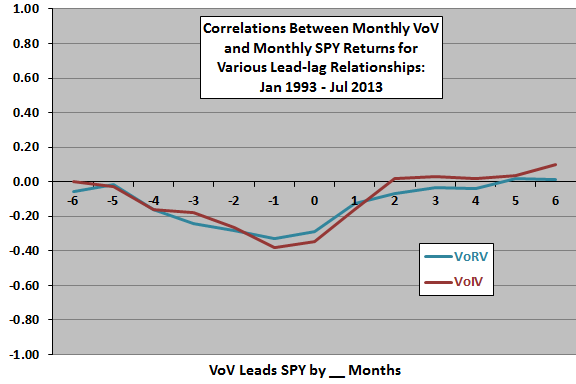
The next chart summarizes Pearson correlations between monthly SPY returns and monthly levels of VoRV and VoIV for various lead-lag relationships over the available sample period, ranging from SPY returns lead VoV by six months (-6) to VoV leads SPY returns by six months (6). Results indicates that:
- Strong (weak) SPY returns indicate lower (higher) VoRV and VoIV over the next one to four months.
- Higher (lower) VoRV and VoIV modestly indicate weak (strong) SPY returns next month. The indication is slightly sharper but less persistent for VoIV than VoRV.
For insight, we look at a scatter plot relating VoIV to next-month SPY return.
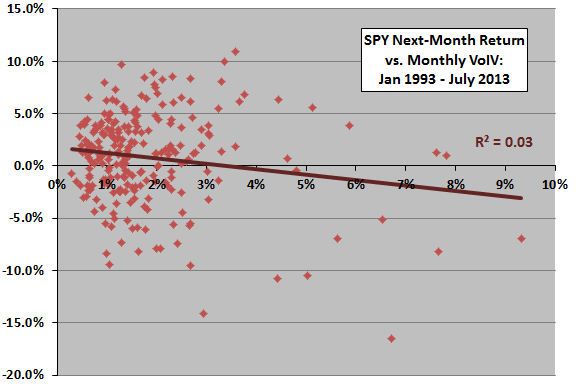
The following scatter plot relates next-month SPY return to VoIV over the available sample period. The Pearson correlation is -0.16 and the R-squared statistic is 0.03, indicating that VoIV explains 3% of the variation in next-month SPY returns.
As an aside, using VIX instead of VoIV as the dependent variable yields an R-squared statistic of 0.000, indicating that VIX itself has no predictive power for next-month SPY return.
To check for non-linearity in the relationship between SPY return and VoIV, we look at returns by range of VoIV.
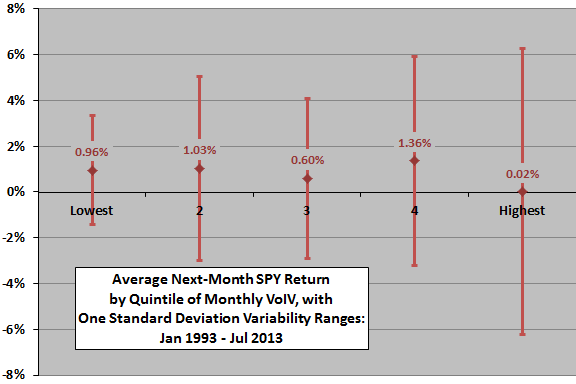
The next chart summarizes average monthly SPY returns by ordered fifth (quintile) of VoIV over the available sample period, with one standard deviation variability ranges. Results suggest that bad months for SPY (low average return and high volatility) tend to concentrate after high VoIV levels, suggesting a strategy that exits stocks after very high VoIV measurements.
How does such a strategy perform?
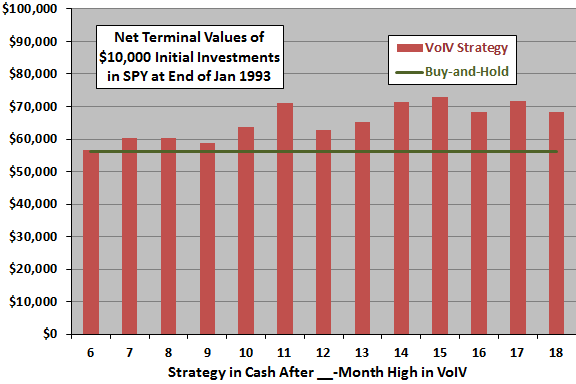
The next chart shows terminal values at the end of July 2013 for two $10,000 initial investments at the end of January 1993, as follows:
- The VoIV Strategy is in SPY (cash) after months when VoIV ends the month below (at) its X-month maximum, with X ranging from six to 18 months. This strategy assumes a SPY-cash switching friction of 0.2% and no return on cash or tax implications of trading.
- Buy and hold SPY.
The VoIV Strategy outperforms Buy-and-Hold for almost all values of X, 15-month maximum for VoIV optimal. For this optimal case, the VoIV Strategy is in SPY about 89% of the time, with average monthly return 0.89% (0.80% for Buy-and-Hold) and standard deviation of monthly returns 4.02% (4.32% for Buy-and-Hold). Optimization incorporates data snooping bias, thereby overstating expected out-of-sample performance.
Adding a return on cash would slightly improve the performance of the VoIV strategy (but involves only 26 of 244 months).
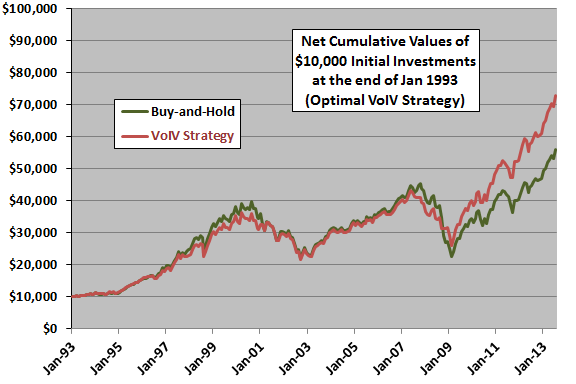
For insight, we look at the detailed trajectory of the VoIV Strategy.
The final chart tracks the cumulative values of the optimal VoIV Strategy (exit stocks on 15-month VoIV high) and Buy-and-Hold over the sample period. The outperformance of the VoIV strategy concentrates in the last four years of the sample period.
In fact, the correlation between monthly VoIV level and next-month SPY return is -0.01 for January 1993 through December 2007 and -0.33 for January 2008 through July 2013. This inconsistency undermines belief in a reliable relationship (or alternatively suggests a regime change).
In summary, evidence suggests that the volatility of VIX may have some power to predict stock market return at a monthly horizon, but the predictive power is present only in recent data.
Cautions regarding findings include:
- As emphasized, the power of VoIV to predict stock market returns stems entirely from the last few years of the sample period.
- Strategies based on measurement intervals other than one month and on a fixed rather than variable VoIV threshold may work better (but experimentation incorporates data snooping bias, and in-sample analysis incorporates look-ahead bias).
See “VIX and Future Stock Market Returns” for analysis of VIX as a stock market return predictor.