Does purifying stock return rankings of any dependence on Fama-French three-factor model risk factors enhance momentum strategy performance? In an update of their August 2009 paper entitled “Residual Momentum”, David Blitz, Joop Huij and Martin Martens suppress exposures of a conventional stock momentum strategy to market, size and book-to-market ratio risk factors by ranking stocks on residual returns instead of total returns. They calculate the residual return for each stock each month as the error term from a regression of its total returns versus the three risk factors over the past 36 months (excluding stocks without 36-month histories). For a total return momentum benchmark, they rank stocks each month based on total return over the last 12 months, excluding the most recent month. For residual return momentum, they rank stocks each month based on residual returns divided by their respective standard deviations over the past 12 months, excluding the most recent month. For both strategies, they measure the momentum effect as the average gross return on hedge portfolios that are long (short) the equally weighted tenth of stocks with the highest (lowest) past returns. They focus on a one-month holding interval, but also consider 3-month, 6-month and 12-month holding intervals (with overlapping portfolios). Using monthly returns for a broad sample of U.S. common stocks and contemporaneous three-factor returns during January 1926 through December 2009, they find that:
- Residual return momentum is about twice as profitable as total return momentum on a gross risk-adjusted (Sharpe ratio) basis, due mostly to volatility suppression. For example, using a one-month holding interval (no overlapping portfolios) over the entire sample period:
- The annualized gross return for residual (total) return momentum is 11.2% (10.3%).
- The annualized volatility for residual (total) return momentum is 12.5% (22.7%).
- The annualized gross Sharpe ratio for residual (total) return momentum is 0.90 (0.45).
- The annualized gross three-factor alpha for residual (total) return momentum is 10.8% (8.0%).
- Residual return momentum is more reliable and persistent than total return momentum. For example:
- Average gross returns increase more systematically across deciles for residual return momentum than total return momentum.
- For a 12-month holding interval, residual (total) return momentum generates an annualized gross return of 3.9% (0.16%).
- Residual return momentum generates higher gross Sharpe ratios than total return momentum for all ranking and holding intervals.
- Residual return momentum is more consistent over time and across the business cycle than total return momentum (see chart below). For example, for a one-month holding interval:
- Since 1960, the relative performance of residual return momentum and total return momentum is the same as that for the full sample.
- During 2000 through 2009, residual (total) return momentum is profitable (unprofitable), with a gross annualized return of 4.7% (-8.5%).
- During the 1930s and the 2000s, total return momentum suffers drawdowns exceeding 80%, more than twice the contemporaneous drawdowns for residual return momentum.
- Residual (total) return momentum generates gross annualized returns of 12.5% (14.7%) during NBER expansions and 5.6% (-8.7%) during contractions.
- Residual return momentum winners and losers are less concentrated among small, volatile stocks and specific industries than those for total return momentum. Specifically:
- Portfolio reformation trading frictions are likely lower for residual return momentum than total return momentum.
- The January effect is not pronounced for residual return momentum. For example, with a one-month holding interval, the average gross January return for residual (total) return momentum is -0.3% (-2.6%).
- Considering only the tenth of stocks with the largest market capitalizations and a one-month holding interval, residual (total) return momentum generates a gross annualized Sharpe ratio of 0.60 (0.36).
- Accounting for industry risks only marginally increases the gross annualized Sharpe ratio for residual return momentum.
The following chart, taken from the paper, compares gross cumulative performances of total return momentum and residual return momentum over the entire sample period. In general, residual return momentum performance is more consistent than that of total return momentum.
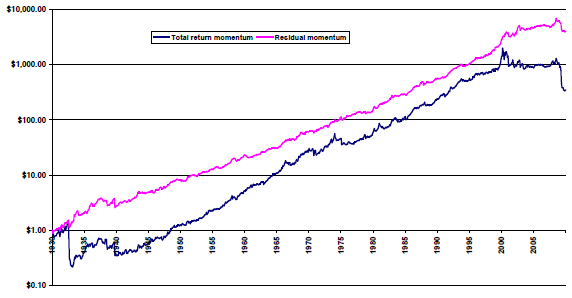
In summary, evidence indicates that momentum strategies based on past stock returns stripped of market, size and value risks are more profitable and reliable than momentum strategies based on total past stock returns.
Cautions regarding findings include:
- The study presents gross, not net, performance. Accounting for the trading frictions associated with periodic portfolio reformation and the costs of shorting losers would reduce reported returns. These costs would be substantial over much of the sample period (see “Trading Frictions Over the Long Run”). Moreover, shorting may not always be feasible.
- The burdens of monthly data collection/calculations for residual return momentum are substantial. The study does not account for associated costs (or management fees, if delegated).
See “Purified Stock Momentum with Crash Suppression”, which employs more recent data in a similar analysis. See also “Purified Short-term Stock Reversal”, which applies the above methodology to short-term reversal rather than intermediate-term momentum.