Does the conventional wisdom of a declining allocation to stocks throughout retirement really work best? In their September 2013 paper entitled “Reducing Retirement Risk with a Rising Equity Glidepath”, Wade Pfau and Michael Kitces explore alternative stocks-bonds allocations during retirement. They consider retirees planning for annual withdrawals of an inflation-adjusted 4% or 5% of retirement date assets over 20, 30 or 40 years. They consider three scenarios for future stocks/bonds return statistics (see the table below): (1) assumptions prepared for the MoneyGuidePro financial planning software as of July 2013; (2) a pessimistic scenario more closely calibrated to the current low-interest rate environment, but with an historical equity risk premium; and, (3) an optimistic scenario with stock and bond returns based on historical averages for 1926 through 2011. They assume year-end withdrawals and rebalancings of residual assets to target allocations, with withdrawals covering tax obligations. If a withdrawal pushes the account balance to zero, the portfolio fails. They also consider both the potential failure magnitude and upside potential. They consider 11 at-retirement equity allocations ranging from 0% to 100% in 10% increments gliding linearly to each of 11 at-horizon equity allocations ranging from 0% to 100% in 10% increments (a total of 121 glidepaths). Using outputs from 10,000 Monte Carlo simulations for each of the 121 glidepaths for each combination of withdrawal rate, retirement horizon and future return scenario, they find that:
- Across all withdrawal rate, retirement horizon and future return scenarios, the glidepaths that increase the equity allocation during retirement provide the highest sustainable withdrawal rates for a set 10% failure rate.
- Declining equity glidepaths do not consistently suppress portfolio failure rates, and static allocations generally underperform pronounced upward glidepaths.
- In general, the optimal range for the at-retirement (at-horizon) equity allocation is 20%-40% (40%-80%).
- In simulations that begin with poor returns during the first half of retirement, a downward glidepath misses mean-reverting good returns in the second half of retirement. Conversely, a rising equity glidepath in simulations with strong returns early in retirement boosts the portfolio such that poor returns later are not critical.
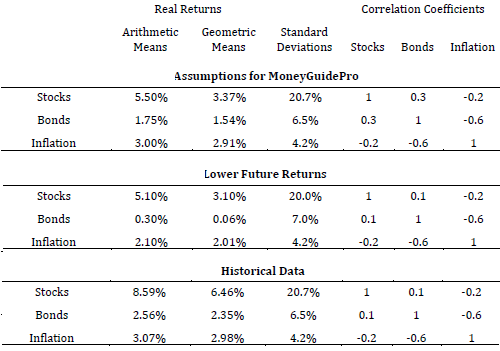
The following table, extracted from the paper, summarizes the three scenarios specified above, including expected annual mean returns, expected annual return volatilities (standard deviations), expected correlation of stock returns and bond returns and expected inflation rate. The second (third) scenario is the most pessimistic (optimistic).
In summary, evidence suggests that the optimal lifetime equity exposure looks less like a slow and steady downward slope and more like a U, with minimum stock allocation at the point of retirement and greater allocations both earlier and later.
Cautions regarding findings include:
- The historical sample is very short for estimating parameter values for 20-year, 30-year or 40-year intervals (only two to four intervals of historical data). In other words, confidence that 1926-2011 is representative is statistically low.
- The model methodology (parameter randomization for Monte Carlo simulation) assumes tame return distributions. To the extent that actual distributions are wild (for example, disastrous returns versus poor returns), “normal” interpretations of model outputs break down.