Which long-term smoothed (10-year average) stock valuation metric works best to screen stocks? In the end-of-September 2013 version of their paper entitled “On the Performance of Cyclically Adjusted Valuation Measures”, Wesley Gray and Jack Vogel compare the abilities of five valuation ratios expressed as yields to predict U.S. stock returns, as follows:
- 10-year average real earnings to market capitalization (CA-EM)
- 10-year average real book values to market capitalization (CA-BM)
- 10-year average real earnings before interest, taxes, depreciation and amortization to total enterprise value (CA-EBITDA/TEV)
- 10-year average real free cash flow to total enterprise value (CA-FCF/TEV)
- 10-year average real free gross profits to total enterprise value (CA-GP/TEV)
They adjust for inflation using the monthly U.S. Consumer Price Index (CPI). Each year on June 30 (with accounting data lagged to ensure availability), they sort stocks into tenths (deciles) based on each ratio. They then calculate monthly decile returns over the next 12 months based on equal initial weights, with either annual (next June 30) or monthly decile reformation. For monthly reformation, they recalculate market capitalizations (but not valuation ratios) each month. They also test a stock return momentum overlay, each month splitting each valuation ratio top decile into high-momentum and low-momentum halves, with momentum defined as cumulative return from 12 months ago to one month ago. They do not account for trading frictions or taxes. Using stock prices and accounting data for U.S. firms with at least 10 years of the required accounting data and market capitalizations above the 40th percentile for NYSE-listed stocks, and contemporaneous CPI data, during 1962 through 2012, they find that:
- There is a clear systematic relationship between cheapness and portfolio performance for all valuation ratios except CA-FCF/TEV. Gross compound annual growth rates (CAGR), gross Sharpe ratios, gross Sortino ratios and maximum drawdowns are worse for expensive stocks than cheap stocks for all ratios.
- For annual decile reformation, CA-BM is marginally the best predictor of stock returns. The annually reformed top CA-BM decile generates gross CAGR 16.6%, gross annual Sharpe ratio 0.64 and gross annual Sortino ratio 0.85.
- Monthly decile reformation improves the gross performance of all valuation ratios, with CA-BM again the top performer. The monthly reformed top CA-BM decile generates gross CAGR 19.3%, gross annual Sharpe ratio 0.69 and gross annual Sortino ratio 1.06.
- Using the high-momentum half of the top decile boosts performance of all valuation ratios by at least 1% annually, with CA-BM again the top performer. The high-momentum half of the monthly rebalanced top CA-BM decile generates gross CAGR 21.6%, gross annual Sharpe ratio 0.86 and gross annual Sortino ratio 1.20. For each valuation ratio, the high-momentum half of the top decile clearly outperforms the low-momentum half over the entire sample period and two approximately equal subperiods.
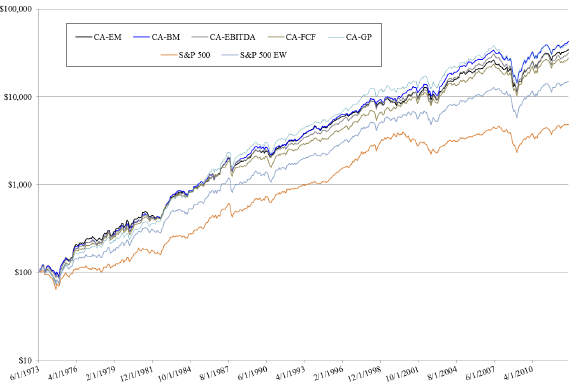
The following chart, taken from the paper, compares on a logarithmic scale the gross cumulative performances of $100 initial investments in the annually reformed top decile of all five valuation ratios during July 1973 (when 10-year ratios are first safely available) through December 2012. The chart also shows the performances of the capitalization-weighted and equal-weighted S&P 500 as benchmarks. All five valuation ratio top deciles beat the two benchmarks. CA-BM has the highest terminal value.
In summary, evidence indicates that 10-year smoothed real valuation ratios effectively identify high-performing U.S. stocks, with book value-to-market capitalization marginally the best. More frequent market capitalization calculation/decile reformation and a momentum overlay both enhance stock screening.
Cautions regarding findings include:
- The sample is not large in terms of the number of independent 10-year measurement intervals (about four), greatly limiting confidence that CA-BM is fundamentally better than other ratios or just lucky.
- As noted, return calculations are gross, and trading frictions are relatively high during much of the sample period. Monthly reformation and the momentum overlay elevate portfolio turnover. Including trading frictions would reduce reported returns, and findings based on net return could differ from those based on gross returns. Exclusion of small-capitalization stocks mitigates this concern. The contact author reports that annual reformation generates top decile turnover in the range 70-80% and that monthly reformation generates monthly top decile turnover turnover usually around 30-50%.
- While momentum works in both subperiods, the effect is noticeably weaker in the second part than the first part.