Does the aggregate trading of retail investors usefully predict future stock market returns? Each month, TD Ameritrade samples the equity market exposures of retail clients and publishes the Investor Movement Index (IMX) as a summary statistic. They calculate IMX via a proprietary methodology as the median bullishness/bearishness score for an equally treated monthly sample of retail clients who have traded recently. The IMX release date for a calendar month is about one trading week into the next month. TD Amertirade advises: “It’s best to review IMX trends over time, rather than focusing on one month’s score. …There are no defined bullish/bearish thresholds for the index. Scores should be viewed relative to other periods…” To investigate the usefulness of IMX as a stock market predictor, we relate both monthly IMX and monthly change in IMX to future returns. Using monthly values of IMX and both calendar month and five-day shifted month S&P 500 Index and SPDR S&P 500 (SPY) returns during January 2010 through August 2013, we find that:
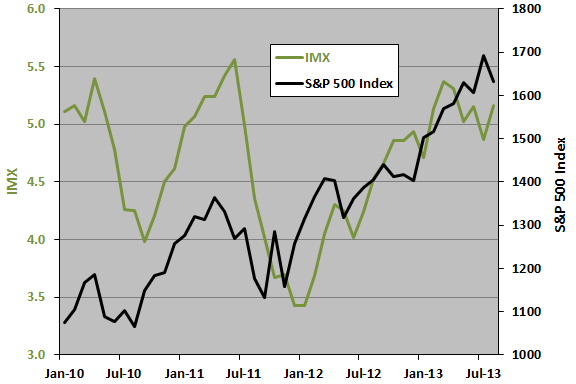
The following chart shows IMX and the S&P 500 Index over the available sample period. The average monthly value of IMX is 4.6, with standard deviation 0.6. The average monthly change in IMX is 0.0.
It appears that IMX turning points slightly lag those of the S&P 500 Index. However, graphical interpretation tends to be subjective. For precision, we use scatter plots.
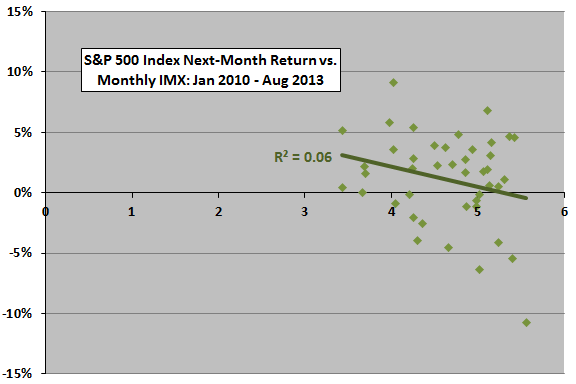
The following scatter plot relates S&P 500 next-month return to monthly IMX over the available sample period. The monthly return calculations take into account the one-week gap between month end and IMX release, so returns are exploitable. Results indicate a somewhat negative relationship (low IMX is better for stocks than high IMX). The Pearson correlation between the two series is -0.25 and the R-squared statistic 0.06, indicating that variation in IMX explains 6% of the variation in stock market returns.
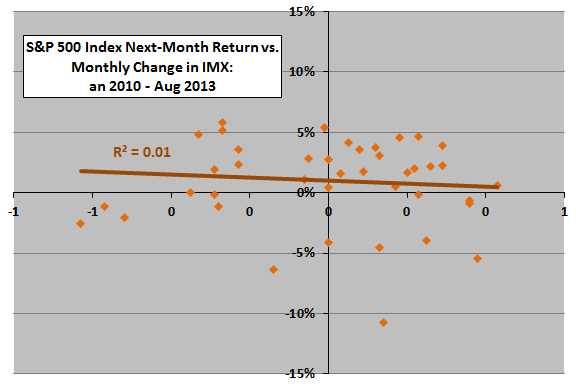
In case the monthly change in IMX is a stronger predictor than the index itself, we substitute change in IMX for IMX.
The next scatter plot relates S&P 500 next-month return to monthly change in IMX over the available sample period. The monthly return calculations again take into account the one-week gap between month end and IMX release. Results indicate a slightly negative relationship. The Pearson correlation between the two series is -0.09 and the R-squared statistic 0.01, indicating that variation in the change in IMX explains only 1% of the variation in stock market returns. It appears that level of IMX is a more useful predictor than monthly change in IMX.
Might signals be stronger over some horizon other than one month?
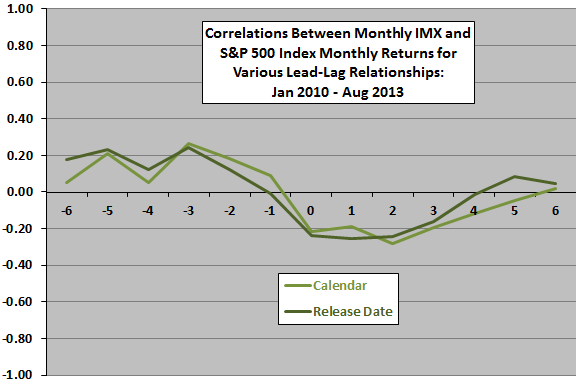
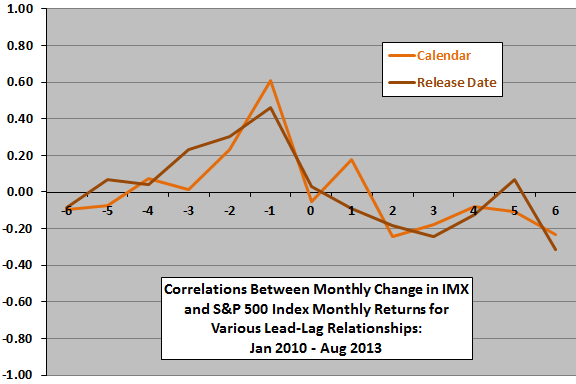
The next two charts plot correlations between monthly S&P 500 Index returns and monthly level of IMX (upper chart) and monthly change in IMX (lower chart) for various lead-lag relationships, ranging from stocks lead IMX metrics by six months (-6) to IMX metrics lead stocks by six months (6). The charts present results based on both calendar month and release date month returns.
The upper chart indicates that stock market return leads IMX positively by one to six months, and IMX leads stock market return negatively by one to three months. In other words, high levels of IMX over the past three months indicate lower returns. The persistence of the relationship over three months suggests use of quarterly rather than monthly data (but the series is very short in terms of number of quarters).
The lower chart indicates pronounced short-term trend-following behavior among sampled investors. When the stock market is strong (weak) last month, IMX moves higher (lower) this month. The case for change in IMX leading stock market returns is weak and may be predominantly noise.
The sample is small for these lead-lag analyses.
How does a trading strategy based on IMX level perform?
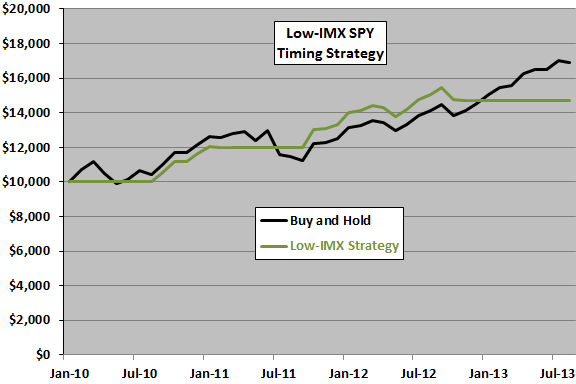
The final chart compares cumulative values of $10,000 initial investments in: buying and holding dividend-adjusted SPY (Buy and Hold); and, (2) holding cash when IMX is above its sample average and SPY when IMX is at or below average (Low-IMX Strategy). Assumptions are:
- Any cash-SPY switches take place at the close on the fifth trading day of months after IMX measurement months (approximately matching IMX release dates).
- Return on cash is zero (approximately true for the sample period).
- One-way trading friction is 0.2% (there are only four trades, so friction has little effect).
- Ignore tax implications of trading.
The Low-IMX Strategy has a lower terminal value than Buy and Hold. The average monthly return for the Low-IMX Strategy (Buy and Hold) is 0.9% (1.1%), with standard deviation 2.4% (3.8%). The Low-IMX Strategy suppresses volatility but sacrifices some return.
The optimal in-sample threshold for IMX is about 5.4, but the Low-IMX Strategy barely outperforms Buy-and-Hold even with threshold optimization. The range of outperforming thresholds is small, suggesting luck rather than predictive power.
In summary, evidence from simple tests on a short sample does not support belief that TD Ameritrade’s IMX is useful for timing the U.S. stock market.
Cautions regarding findings include:
- As noted, the sample period is very short, especially in terms of variety of market conditions.
- The above analyses are in-sample, such that specifying the Low-IMX Strategy threshold involves data not available to an investor operating in real time during the sample period. The sample is too short for out-of-sample testing.
- The relationship between IMX and stock market returns may be non-linear, but the sample is very small for detecting tail effects.