Do firm efforts to pay shareholders directly (via dividends) and indirectly (via share repurchases and paydown of debt) translate to stock outperformance? In their May 2012 paper entitled “Enhancing the Investment Performance of Yield-Based Strategies”, flagged by a subscriber, Wesley Gray and Jack Vogel compare aggregate performance statistics of stocks ranked by the following four progressively comprehensive yield metrics:
- DIV: dividend yield.
- PAY1: payout encompassing dividend plus share repurchase yield.
- PAY2: payout encompassing dividend plus net repurchase (repurchase minus issuance) yield.
- SHYD: comprehensive shareholder yield encompassing dividend plus net repurchase plus net debt paydown (annual difference in debt load divided by market capitalization) yield.
They focus on annually rebalanced, value-weighted portfolios with financial stocks excluded. Using monthly return, dividend, stock repurchase/issuance, debt load and other accounting data for a broad sample of U.S. stocks during 1971 through 2011, they find that:
- Dividend payers tend to be relatively big, liquid, value stocks. Among dividend payers, high-yield stocks tend to be small, illiquid and cheap compared to low-yield stocks.
- Among stocks with non-zero yields, the value-weighted fifth (quintile) of stocks with the highest yields on average outperforms the value-weighted quintile with the lowest yields for all four yield metrics.
- For the value-weighted high-yield quintile (see the chart below):
- DIV generally underperforms PAY1, PAY2 and SHYD with financials excluded, and dramatically underperforms with financials included.
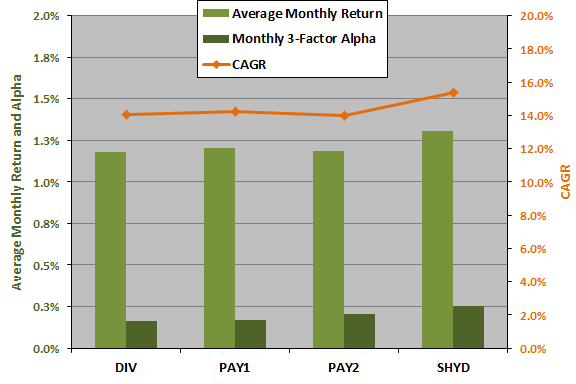
- SHYD outperforms other metrics. Over the entire sample period (excluding financials), the gross average monthly return for SHYD (DIV) is 1.3% (1.2%), with gross monthly 3-factor (market, size, book-to-market) alpha 0.25% (0.16%).
- Excluding financials, PAY1, PAY2 and SHYD outperform DIV in three of four decades (2002-2011 is the exception). Including financials, SHYD is the top performer in all decades.
- However, during 2004 through 2011 (excluding financials), DIV easily outperforms the other yield metrics, with a gross monthly 3-factor alpha of 0.56% (double the 0.28% for SHYD).
- Double sorts on yield metrics and payout percentage (yield divided by income) offer yield strategy enhancements:
- For example, high-DIV stocks with low (high) payout percentages generate a gross monthly 3-factor alpha of 0.24% (0.00%). The effect is weaker for other yield metrics.
- The gross monthly 3-factor alpha for low-PAY2 (low-SHYD), high-payout percentage stocks is -0.61% (-0.55%) but this poor performance may relate to costs/infeasibility of shorting these stocks. The effect is weaker for the other two yield metrics
- In general, findings are stronger for equal-weighted portfolios.
The following chart, constructed from data in the paper, compares average monthly returns, 3-factor alphas and compound annual growth rates (CAGR) for the value-weighted top quintile of stocks sorted annually (on July 1) according to yield over the entire sample period. Sorts exclude financial stocks and stocks with zero yield. SHYD outperforms the other yield metrics for all three performance measures.
In summary, evidence indicates that a high-yield strategy based on a broad definition of shareholder yield (encompassing dividends, net share repurchases and debt paydown) outperforms high-yield strategies based on narrower definitions.
Cautions regarding findings include:
- Reported returns are gross, not net. Accounting for trading frictions (mitigated by annual rebalancing) would reduce reported returns. It is possible that turnover varies by yield metric.
- As noted in the paper the cost/infeasibility of shorting may preclude exploitation of poor returns from low-PAY2 and low-SHYD, high-payout percentage stocks. See “Lendable Share Supply a Roadblock to Shorting Strategies?”.
- Testing multiple indicators on the same set of data introduces data snooping bias, tending to overstate (understate) the performance of the best (worst) indicator.
For an implementation of a closely related strategy since May 2013, see Cambria Shareholder Yield ETF (SYLD), which “invests in 100 stocks with market caps greater than $200 million that rank among the highest in (a) paying cash dividends, (b) engaging in net share repurchases, and (c) paying down debt on their balance sheets.”