What factors truly explain movements in the price of gold? In his January 2014 paper entitled “Facts and Fantasies about Gold”, Joachim Klement checks the validity of common explanations for changes in gold price. Specifically, he investigates whether gold price responds to: change in inflation expectation; change in real interest rate; financial crises; changes in currency exchange rates; change in the marginal cost of gold production; central bank gold sales and purchases; and, change in the demand for gold-linked exchange-traded funds (ETF). Using monthly data for gold price and these potentially explanatory factors as available during 1970 through 2013, he finds that:
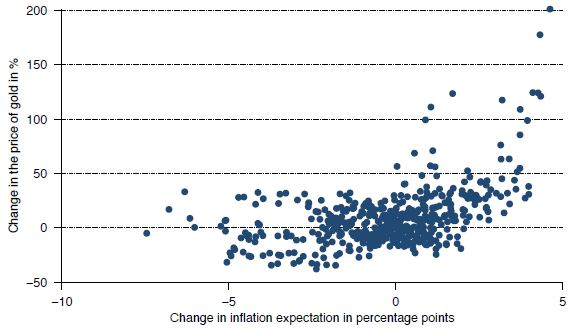
- Over the last 40 years, there is a reliable positive non-linear contemporaneous relationship between change in inflation expectation and change in gold price (see the first chart below). Also, when expected inflation is 4% or higher, gold price tends to rise the next year. These findings hold for recent subsamples of ten and five years.
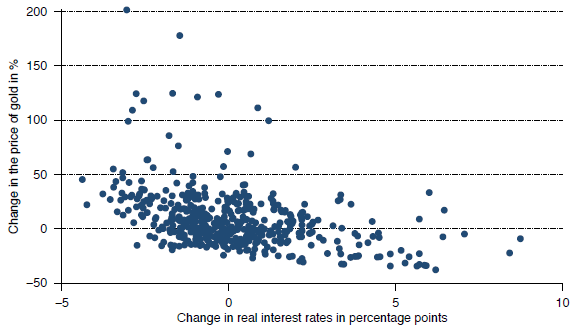
- Over the last 40 years, there is a reliable negative non-linear contemporaneous relationship between change in real interest rate and change in gold price (see the second chart below). Also, when the real interest rate is high (low), gold price tends to fall (rise). These findings hold for recent subsamples of ten and five years. A falling (rising) real interest rate typically coincides with large increases (small decreases) in gold price.
- When equity prices drop during a crisis, gold price tends to remain stable or rise slightly.
- While there are negative contemporaneous relationships between U.S. dollar-other currency exchange rates and gold price, correlations are small, typically explaining less than 10% of the variation in gold price.
- During 2001-2012, marginal cost of gold production is a floor for gold price. As of the end of 2013, however, gold price is about 10% below this cost. If this condition persists, global gold production is likely to decline in coming years.
- Over the last 30 years, there is no apparent relationship between western central bank gold transactions (predominantly selling) and gold price. So far, the impact of transactions by non-western central banks is not noticeable.
- Over the last five years, physical gold ETFs and similar instruments represent roughly 5% of global demand (compared to more than 80% for gold bars, coins and jewelry). Contemporaneous correlations between gold ETF holdings and gold price for intervals of one day to one year are in the range 0.2 to 0.4. Most likely, changes in gold price drive buying and selling of these ETFs, not vice versa.
- Over the last three years, 12-month gold price forecasts of three major global banks are highly inaccurate. None foresaw the price peak of mid-2011. Forecasts relate more closely to contemporaneous gold price than to target date price.
The following chart, taken from the paper, relates change in gold price to change in inflation expectation (average annual inflation rate over the previous five years) for overlapping 12-month measurement intervals based on monthly data for 1970 through 2013. The relationship is positive and non-linear. In other words, rising (falling) gold price tends to coincide with rising (falling) inflation expectation, particularly when inflation expectation changes sharply. However, it is extremely difficult to predict changes in inflation expectation.
The next chart, also from the paper, relates change in gold price to change in real interest rate for overlapping 12-month measurement intervals based on monthly data for 1970 through 2013. The relationship is negative and non-linear. In other words, rising (falling) gold price tends to coincide with falling (rising) real interest rate, particularly when real interest rate changes sharply. However, it is extremely difficult to predict changes in real interest rate.
In summary, evidence suggests that the principal drivers of gold price are inflation expectation and (less strongly) real interest rate and marginal cost of gold production, but predicting these drivers is difficult to near impossible.
The author speculates that major central bank actions will dominate gold price behavior at least through 2014 as follows: (1) continuation of ultra-expansive monetary policies may elevate inflation/inflation expectation and depress real interest rate, thereby pressuring gold price upward; or, (2) normalization of monetary policy and/or effective management may depress inflation expectation and elevate real interest rate, thereby pressuring gold price downward.
Cautions regarding findings include:
- The use of overlapping measurement intervals in the two charts above implies a larger sample size than actually used.
- One might conclude from the first chart above that only increases in inflation expectation affect gold price.
- Some samples are very small, especially in terms of secular trends, for confident inference.
Compare and contrast with “Future of the Price of Gold”.