Pairs traders often use a normalized price gap threshold of two standard deviations to generate signals for opening trades. Is there a better metric for generating these signals? In the January 2014 version of their paper entitled “Pairs Trading with Copulas”, Wenjun Xie, Qi Rong Liew, Yuan Wu and Xi Zou compare the performances of pairs trading signals based on copulas and normalized price gaps. A copula allows for non-linearity, asymmetry and price level-sensitivity in the relationship between prices of the two members of a pair, while a normalized price gap does not. Since stock price distributions generally exhibit these non-normalities, a copula approach could improve pairs trading efficiency. For testing, the authors assume a common pairs identification and parameter/distribution estimation interval of the past 252 trading days, during which they identify the pairs from 89 U.S. utility stocks with the lowest sum of daily squared normalized price deviations. They then trade each of these best pairs during the next 126 trading days based on either copula or normalized price gap rules. They buy the underperformer and sell the outperformer at the end of the day that prices diverge through a specified threshold and close both positions at the end of the day that prices converge (or at the end of the trading interval if they do not converge). Alternatively, they impose a one-day delay in signal execution to allow time for data collection/processing. They calculate performance based on actual deployed capital, thereby accounting for idle capital (in other words, at the portfolio level). Using daily prices for the 89 U.S. utility stocks during January 2003 through December 2012, they find that:
- Copulas consistently outperform normalized price gaps for pairs trading based on both average monthly return (see the chart below) and average monthly win rate.
- For the copula approach, a portfolio of the top five pairs substantially outperforms a portfolio of the top 20 pairs.
- A one-day delay in signal execution reduces performance for both strategies.
- Copulas identify more trades, thereby bearing somewhat greater risk (standard deviation of monthly returns and maximum monthly drawdown) compared to normalized price gaps.
- Regarding trading frictions:
- Copula performance easily exceeds assumed short-selling costs of 0.04% to 0.15% per year for large traders.
- Trading of the top five pairs with one day delay triggers an average of 6.8 transactions per six-month trading interval, generating cumulative trading friction of about 1.10%, much less than the average 2.64% gross average return.
- Results are robust across different copula signal thresholds and across subperiods.
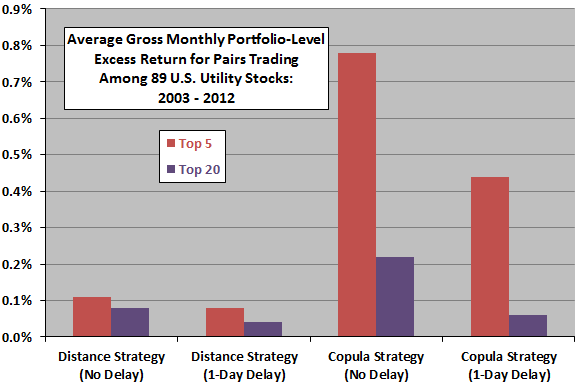
The following chart, constructed from data in the paper, compares average gross monthly excess returns at the portfolio level for a conventional two standard deviation normalized price gap (Distance) strategy and a copula-based (Copula) strategy, without and with a one-day delay between signal generation and trade execution. The Top 5 and Top 20 pairs are those from among 89 U.S. utility stocks with the lowest sum of daily squared normalized price deviations over the last 252 trading days. The trading interval is the next 126 trading days.
Results indicate that the Copula strategy far outperforms the Distance strategy over the sample period, but with a substantial penalty for delay in trade execution. For the Distance (Copula) strategy with one-day delay, the percentage of negative gross monthly returns is 48% (34%) for the Top 5 pairs and 52% (47%) for the Top 20 pairs.
In summary, evidence indicates that copula-based statistical methods that accommodate non-normalities in pair price relationships (unlike normalized price gaps) may substantially improve pairs trading performance.
Cautions regarding findings include:
- Shorting costs and trading frictions may be higher than assumed for many traders. Moreover, short sellers must pay dividends, which may be material for utility stocks (and different ex-dividend dates may drive pair price divergences).
- The copula strategy is much more complex than the conventional normalized price gap strategy, perhaps beyond the reach of many traders (or costly if delegated to an expert).
- The authors state that they use “the five most commonly used copulas,” and that “practitioners can can involve more copulas in the fitting process to raise accuracy.” Testing of multiple models on the same data introduces snooping bias, such that the best-performing model likely overstates expectations. Robustness tests mitigate this concern.
- The authors acknowledge that their process of identifying top pairs for trading is conventional, assuming a linear relationship between prices of the two stocks in a pair, and that applying copulas to the pairs identification interval as well as the trading interval may improve overall strategy performance.
Perhaps the principal message for many pairs traders is that they may face increasingly sophisticated competitors.