Do professional analysts systematically miss target prices for individual stocks? In the November 2013 draft of their paper entitled “Understanding and Predicting Target Price Valuation Errors”, Patricia Dechow and Haifeng You measure the errors in returns implied by professional stock analyst consensus price targets and examine the sources of these errors. They further investigate whether investors can anticipate and exploit consensus target price errors. They construct consensus target prices at the end of each month as the simple average of the most recent target price forecasts issued by following analysts within the last 90 days. Using analyst stock price targets, actual monthly returns and trading volumes, firm accounting data and institutional ownership data spanning April 1999 through December 2011 (227,127 firm-month observations), they find that:
- Over the sample period, future annual returns implied by analyst consensus target prices average 22.7%, peaking in 2000 at 42.6%.
- Actual future annual returns average 9.3%, indicating an average annual forecast bias of 13.4%.
- The average absolute annual forecast error is 41.8%.
- Forecast bias and inaccuracy are particularly high during 2000-2002 and 2007-2008.
- About 10% of consensus target prices imply negative annual returns (average -4.6%). Among stocks with positive implied returns, the top fifth has an average implied annual return of 60.0%. However, actual future annual returns exhibit little variation across ranges of implied returns.
- Stocks with the highest implied returns tend to have relatively high sales growth, low return on assets, high beta, high idiosyncratic volatility, small size, high book-to-market ratio, low return momentum, low dividend yield and high target price forecast bias.
- On average, analysts appear to:
- Overweight past sales growth and underweight past level of earnings.
- Overvalue firms showing losses, especially extreme losses.
- Overvalue volatile stocks.
- Undervalue firms with large cash flows relative to those with large accruals.
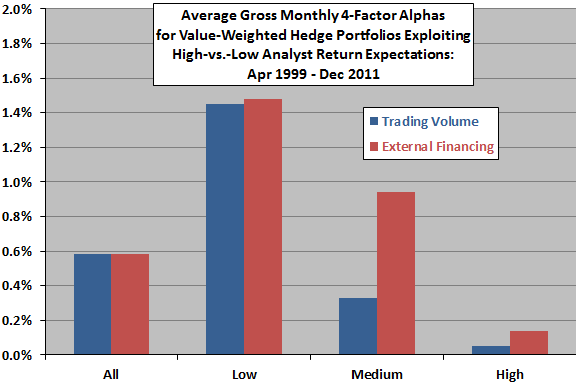
- Analysts are on average especially optimistic about firms raising financing and stocks with high trading volumes, suggesting biases associated with investment banking and brokerage services offered by analyst employers. Investors who use analyst stock return expectations can improve performance by correcting for these biases. Specifically, over the entire sample period (see the chart below):
- A hedge portfolio that is long (short) the value-weighted stocks with the highest (lowest) returns implied by analyst consensus target prices generates an average gross monthly four-factor (market, size, book-to-market, momentum) alpha of 0.58%.
- Restricting this hedge portfolio to the third of stocks with the lowest trading volumes generates an average gross monthly alpha of 1.45% (about 17% annualized).
- Restricting this hedge portfolio to the third of stocks with the lowest levels of external financing generates an average gross monthly alpha of 1.48% (about 17% annualized).
The following chart, constructed from data in the paper, quantifies the influences of stock trading volume and firm external financing on average gross monthly four-factor alpha for a hedge strategy that is each month long (short) stocks with the highest (lowest) analyst return expectations. Monthly alpha calculation rules are:
- Sort firms into fifths (quintiles) based on size each month.
- Split each size quintile into thirds (Low, Medium and High) based separately on trading volume and level of external financing, creating 15 segments each.
- Separately for trading volume and external financing, aggregate into three groups the five Low size segments, the five Medium size segments and the five High size segments.
- Separately for the Low, Medium and High trading volume groups and external financing groups, calculate gross returns to a value-weighted hedge portfolio that is long (short) the quintile of stocks with the highest (lowest) analyst return expectations.
- Apply regressions to adjust for market, size, book-to-market and momentum risk factors.
Results indicate that analyst return expectations are much more informative for stocks with low trading volumes or low levels of external financing than for the entire sample (All). Also, the progression of performance across Low, Medium and High groups is systematic. Use of equally weighted portfolios generates similar but stronger results.
In summary, evidence suggests that investors may be able to exploit analyst target prices by screening out the forecasts that are most likely biased by brokerage and investment banking conflicts.
Cautions regarding findings include:
- Reported returns are gross, not net. Accounting for trading frictions and shorting costs would reduce performance.
- Moreover, focusing on stocks with low trading volumes may involve those with especially low liquidities (high trading frictions) and strong shorting constraints (high collateral rates).
- Data collection/processing may be cumbersome for many investors, or costly if delegated. There may be simpler strategies that usefully exploit findings.