Does the relative performance of 10-year U.S. Treasuries and 30-year U.S. Treasuries offer a useful risk-on/risk-off regime change signal? In their February 2014 paper entitled “An Intermarket Approach to Tactical Risk Rotation Using the Signaling Power of Treasuries to Generate Alpha and Enhance Asset Allocation” (the National Association of Active Investment Managers’ 2014 Wagner Award third place winner), Michael Gayed and Charles Bilello examine whether the relationship between the monthly total returns of the 10-year and 30-year Treasuries usefully indicate when to hold (or tilt toward) Treasuries versus stocks. They reason that informed investors migrate toward intermediate-term (long-term) Treasuries when they anticipate strong (weak) economic conditions. Therefore, the relative strength of 10-year and 30-year Treasuries signals when to take an aggressive or defensive investment posture. Using monthly total returns for 10-year and 30-year Treasuries and for the broad U.S. stock market during April 1977 through December 2013, they find that:
- Over the entire sample period, a simple Tactical Risk Rotation Strategy (TRRS) that allocates funds to stocks (Treasuries) when the monthly total return of 10-year Treasuries is greater (less) than that of 30-year Treasuries:
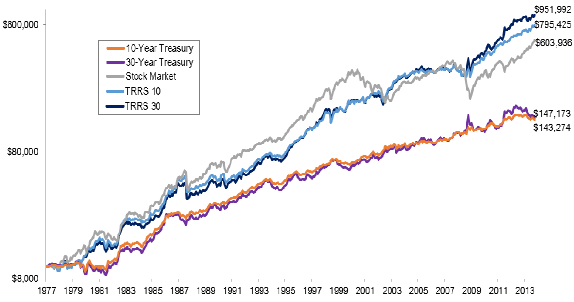
- Outperforms buying and holding stocks by a cumulative 32% when applied with 10-year Treasuries (TRRS10) and 58% when applied with 30-year Treasuries (TRRS30), producing annualized alphas of 3.7% and 4.3%, respectively. (See the chart below.)
- Switches between stocks and bonds roughly bimonthly and holds stocks only 49% of the time, thereby suppressing portfolio volatility and boosting risk-adjusted performance.
- Generates positive alpha in 81% (TRRS10) or 76% (TRRS30) of all rolling 36-month intervals.
- Suffers worst calendar years of -6.0% (TRRS10) or -7.9% (TRRS30), compared to -36.6% for the stock market.
- Treasuries relative strength signals also enhance conventional aggressive, moderate or conservative tactical asset allocation decisions, indicating when to shift between risk-on (months after 10-year Treasuries outperform) and risk-off (months after 30-year Treasuries outperform) allocations.
- The aggressive strategy allocates 80%/20% to the U.S. stock market/Barclays Aggregate Bond Index during risk-on months, but shifts the split toward bonds during risk-off months. Each incremental 5% shift toward bonds for risk-off further increases Sharpe ratio, Sortino ratio and annualized alpha. The maximum tested risk-off shift of 50%/50% has a 65% average exposure to stocks.
- The moderate strategy allocates 60%/40% to stocks/bonds during risk-on months, but shifts the split toward bonds during risk-off months. The maximum tested risk-off shift of 30%/70% produces the best risk-adjusted performance.
- The conservative strategy allocates 30%/70% to stocks/bonds during risk-on months, but shifts the split toward bonds during risk-off months. The maximum tested risk-off shift of 0%/100% produces the best risk-adjusted performance.
The following chart, taken from the paper, compares on a logarithmic scale the cumulative performances of 10-year U.S. Treasuries, 30-year U.S. Treasuries, the broad U.S. stock market and two active strategies that switch between stocks and 10-year Treasuries (TRRS10) and between stocks and 30-year Treasuries (TRRS30) as specified above. Over the entire sample period the active strategies outperform buying and holding stocks.
However, stocks outperform the active strategies during the first 20+ years of the sample period, and cumulative outperformance of the active strategies appears to concentrate during the 2000-2002 bear market and (especially) the 2008 financial crisis.
In summary, evidence indicates that investors may be able to beat buying and holding the U.S. stock market and passive stocks-bonds allocations by shifting toward stocks (bonds) when the prior-month total return for 10-year U.S. Treasuries is above (below) that for 30-year U.S. Treasuries.
The authors note that: (1) for signaling, investors could substitute assets such as iShares 7-10 Year Treasury Bond (IEF) for 10-year Treasuries and iShares 20+ Year Treasury Bond (TLT) for 30-year Treasuries; and, (2) various low-cost passive stock market and Treasuries funds, some of which involve no switching fees, could serve as investment vehicles.
Cautions regarding findings include:
- As noted, outperformance of the active strategies appears to concentrate during 2000-2002 and (especially) 2008. To the extent that such environments are rare in the future, the benefits of the active strategies may diminish. It would be interesting to benchmark the active strategies against a simple stock market timing rule based on intrinsic momentum or simple moving average (see, for example, “Intrinsic Momentum or SMA for Avoiding Crashes?”).
- Reported returns are for index-like series. The costs for creating and maintaining liquid (and constant-duration for Treasuries) proxies for the indexes would lower returns, as would any trading frictions involved in shifting between stock and bond funds.
- A secular decline in interest rates arguably dominates the sample period. A rising interest rate environment may affect active strategy dynamics.
For another approach to assessing the value of information from different U.S. Treasuries durations, see “Yield Curve as a Stock Market Indicator”.