Do financial markets adapt to widespread use of an indicator, such as Bollinger Bands, thereby extinguishing its informativeness? In the August 2014 version of their paper entitled “Popularity versus Profitability: Evidence from Bollinger Bands”, Jiali Fang, Ben Jacobsen and Yafeng Qin investigate the effectiveness of Bollinger Bands as a stock market trading signal before and after its introduction in 1983. They focus on bands defined by 20 trading days of prices to create the middle band and two standard deviations of these prices to form upper and lower bands. They consider two trading strategies based on Bollinger Bands:
- Basic volatility breakout, which generates buy (sell) signals when price closes outside the upper (lower) band.
- Squeeze refinement of volatility breakout, which generates buy (sell) signals when band width drops to a six-month minimum and price closes outside the upper (lower) band.
They assess the popularity (and presumed level of use) of Bollinger Bands over time based on a search of articles from U.S. media in the Factiva database. They evaluate the predictive power of Bollinger Bands across their full sample sample and three subsamples: before 1983, 1983 through 2001, and after 2001. Using daily levels of 14 major international stock market indexes (both the Dow Jones Industrial Average and the S&P 500 Index for the U.S.) from initial availabilities (ranging from 1885 to 1971) through March 2014, they find that:
- The first U.S. news article on Bollinger Bands appears in 1993. The number of articles then rises steadily until 2001, spikes in 2002 and than continues to grow to a peak in 2011.
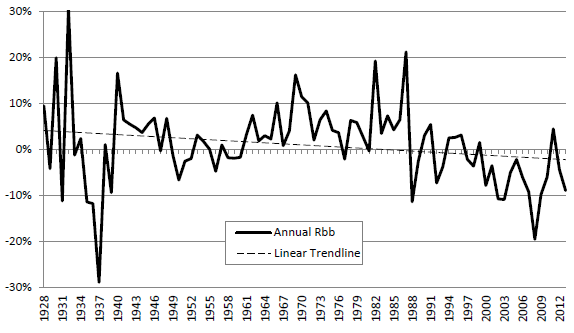
- Applied to the S&P 500 Index, the volatility breakout strategy works well on a net basis for nearly 60 years up to the mid-1980s, but annual returns thereafter are mostly negative (see the chart below).
- In the full sample, volatility breakout signals work consistently.
- Buy (sell) signals produce significantly positive (negative) average gross returns that are higher (lower) than the market returns for 14 (12) indexes.
- The average daily difference between gross buy signal returns and gross sell signal returns is significantly positive for all 14 indexes. Across all indexes, this spread averages 0.29%, compared to an average daily market return of 0.03%.
- Across subsamples, volatility breakout signals lose informativeness over time.
- Before 1983, the average daily spread between gross buy and sell signal returns across all 14 indexes is 0.45%, compared to an average daily market return of 0.02%.
- However, during 1983 through 2001, buy (sell) signals generate higher (lower) returns than the market for only 10 (8) indexes and do not work for the U.S. indexes. The average daily spread between gross buy and sell signal returns across all 14 indexes is 0.30%, compared to an average daily market return of 0.04%.
- After 2001, the strategy exhibits predictive power for only two indexes. The average daily spread between gross buy and sell signal returns across all 14 indexes is 0.00%, compared to an average daily market return of 0.01%.
- Results for squeeze signals are similar, with the method working in the full sample and the pre-1983 subsample and weakening in later subsamples. After 2001, the average daily spread between gross buy and sell signal returns across all 14 indexes is -0.07%, compared to an average daily market return of 0.01%.
- Results are robust to variation in Bollinger Band generation parameters, inclusion of nominal trading frictions and accounting for outliers.
The following chart, taken from the paper, tracks net annual returns for a volatility breakout trading strategy based on Bollinger Bands (Rbb) as applied to the S&P 500 Index over its available sample period. Estimated friction for switching between the index and the risk-free asset is 1%. The strategy works reasonably well before the mid-1980s but has not worked well since.
The 1% one-way trading frictions used to calculate net returns may be too low in some parts of the sample period (overstating strategy performance), about right in other parts and too high for recent times (understating strategy performance). However, gross calculations confirm that the strategy is not profitable in the subperiod after 2001.
In summary, evidence indicates that Bollinger Bands were once informative about future stock market returns, but no longer are due to market adaptation to widespread use.
Cautions regarding findings include:
- The authors note that both market adaptation and data snooping (to discover the signal) can explain the failure of a signal to work after discovery and publication. They argue that the data indicate market adaptation as the likely explanation for Bollinger Bands because the failure is gradual rather than abrupt. However, the chart above appears equivocal regarding gradual versus abrupt failure.
- Use of indexes to calculate returns ignores the costs of maintaining a reasonably liquid tracking fund and thus tends to overstate returns.
- As noted, the assumption of constant 1% one-way trading frictions differs from recent actual trader experience, likely understating performance of strategies based on Bollinger Bands for a recent subperiod. Gross calculation, however, do not suggest recent profitability.
See also “Bollinger Bands: Buy Low and Sell High?” and “Chapter 5: Checking for Market Adaptation”.