Does the stock momentum anomaly interact with the quarterly financial cycle? In his August 2014 paper entitled “Seasonal Patterns in Momentum and Reversal in the U.S. Stock Market: The Consequences of Tax-Loss Sales and Window Dressing”, David Brown examines whether tax-loss selling and window dressing at the ends of calendar quarters affect U.S. stock momentum strategy returns. Each month, he ranks stocks by returns over the last 12 months, skipping the last month to avoid reversal, and then forms a momentum hedge portfolio that is long (short) the capitalization-weighted tenth of stocks with the highest (lowest) past returns, making the long and short sides of the portfolio equal in magnitude. He then measures how this portfolio performs by calendar month to check for end-of-quarter effects. He also investigates whether the level of capital losses among stocks in the portfolio affects performance. Using monthly returns for NYSE, AMEX and NASDAQ common stocks, along with contemporaneous risk-free rates and Fama-French model risk factor returns, during January 1927 through December 2013, he finds that:
- Passage in 1982 of the Tax Equity and Fiscal Responsibility Act, tightening capital gains reporting, affected stock momentum strategy performance (see the chart below):
- During 1927 through 1982, momentum hedge portfolio average gross returns are positive (except in January) and approximately equal across the first (excluding January), second and third months in calendar quarters.
- However, during 1983 through 2013, average gross returns are positive and significant only during third months of calendar quarters.
- Since 1982, selling in March, June, September and December drives a momentum strategy profitability cycle by making the returns of loser stocks large and negative during these months.
- Most momentum hedge portfolio gross profits come from shorting stocks with capital losses. Profits are much larger when most stocks carry such losses.
- Momentum hedge portfolio losses derive largely from return reversals during the first months of calendar quarters, including January.
- These effects are jointly stronger for large-capitalization stocks, suggesting a preference for selling liquid stocks when realizing tax losses.
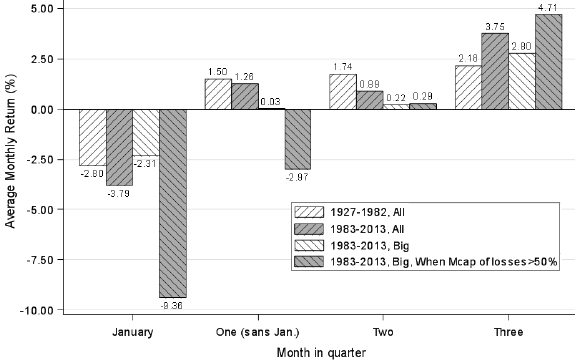
The following chart, taken from the paper, summarizes momentum hedge portfolio gross average returns across calendar quarter months for four samples:
- 1927-1982, All: before tightening of capital gains reporting rules for all stocks in the sample.
- 1983-2013, All: after tightening of capital gains reporting rules for all stocks in the sample.
- 1983-2013, Big: same as sample 2, but only for stocks with market capitalizations above the NYSE 70th percentile at the beginning of the momentum ranking interval.
- 1983-2013, When Mcap of losses > 50%: same as sample 3, but only for months in which aggregate market capitalization of big stocks with tax losses is more than half of total aggregate market capitalization of big stocks.
Results indicate that:
- There is a pronounced turn-of-the-year effect in both subperiods, with losers beating winners among all stocks by an average gross 2.80% per month during 1927-1982 and 3.79% per month during 1983-2013. This effect holds for large-capitalization stocks, especially when there have been large capital losses.
- After 1982, momentum hedge portfolio gross profits come mostly from the third months of quarters, when among all stocks winners beat losers by an average gross 3.75% per month, compared to 1.26% for first months excluding January and 0.89% for second months.
- Post-1982 seasonality is extreme among large-capitalization stocks, for which average gross return is 2.80% during third months of quarters, compared to 0.03% for first months excluding January and 0.22% for second months.
In summary, evidence indicates that tax considerations drive recent quarterly patterns in momentum hedge strategy returns for U.S. stocks, with performance strongest in the third months of quarters, especially at times when many stocks have declined over the past year.
Cautions regarding findings include:
- Reported returns are gross, not net. Accounting for monthly portfolio reformation frictions and shorting costs would reduce these returns.
- Shorting constraints may preclude shorting all losers.
- Results may not be relevant in countries with different capital gains tax laws.