Is there a simple way to tell whether a commodity is overvalued or undervalued? In his May 2014 presentation package entitled “Commodity ‘CAPE Ratios'”, Claude Erb looks at long-term real commodity prices as valuation “crutches” to estimate when commodities are overvalued and undervalued. He provides examples relating real commodity prices to future long-term (10-year) real commodity returns. He employs the U.S. consumer price index (CPI) for inflation adjustment. Using gold price since January 1975, the S&P GSCI Index since January 1970, corn price since April 1965, crude oil price since March 1983 and contemporaneous CPI data through April 2014, he finds that:
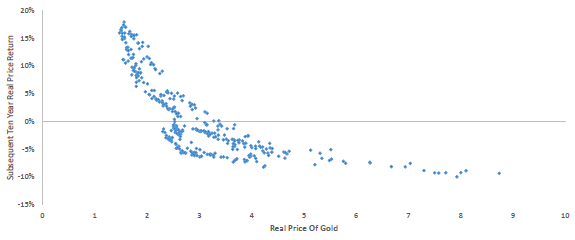
- The real price of gold relates negatively to 10-year future change in real gold price (see the chart below). A strategy that assumes gold’s real value is constant may be able to outperform buying and holding gold on a gross basis.
- The real level of the S&P GSCI relates negatively to the 10-year future change in its real level.
- The real price of West Texas intermediate crude oil relates negatively to 10-year future change in real crude oil price.
- The real price of corn relates negatively to 10-year future change in real corn price.
- The ratio of real crude oil price to real corn price relates negatively to 10-year future change in real crude oil price. A strategy that increases (decreases) crude oil allocation when crude oil is cheap (expensive) compared to corn may be able to outperform buying and holding crude oil or corn..
The following chart, taken from the paper, relates future 10-year change in real gold price to (apparently monthly) normalized real gold price during January 1975 through April 2014. The negative relationship suggests that gold is cheap (expensive) when its real price is low (high) compared to historical levels.
Note that the use of highly overlapping return measurement intervals greatly overstates the number of independent return measurements.
In summary, evidence suggests that investors may be able to exploit commodity overvaluation/undervaluation based on current real price relative to the historical distribution of real prices.
Cautions regarding findings include:
- Return calculations apparently derive from spot prices. Investors generally participate in commodity markets via futures contracts, which incorporate investor expectations for spot prices. Futures returns may therefore differ from spot returns.
- Sample periods are not long in terms of independent 10-year measurement intervals (only three to five). As noted, scatter plots appear to employ highly overlapping measurement intervals, implying much larger sample sizes than actually used.
- Illustrations employ data from full sample periods to define overvalued and undervalued. An investor operating in real time on strictly historical data would set different overvalued/undervalued thresholds as data accumulate.
- Commodities may vary in industrial and consumer utility over time, such that the real price should arguably change.
- Real commodity prices drift slowly relative to an historical mean, such that an investor would have to exercise extreme patience to realize reversion.
- Valuation-based strategies such as those illustrated are often sensitive to the trading (overvaluation/undervaluation) thresholds chosen, and hence are subject to material threshold snooping bias.
- CPI may not be the most appropriate inflation adjustment for commodities consumed industrially or worldwide.