Are gains from tax-loss harvesting, the systematic taking of capital losses to offset capital gains, additive to or subtractive from premiums from portfolio tilts toward common factors such as value, size, momentum and volatility (smart beta)? In their October 2014 paper entitled “Factor Tilts after Tax”, Lisa Goldberg and Ran Leshem look at the effects on portfolio performance of combining factor tilts and tax-loss harvesting. They call the incremental return from tax-loss harvesting tax alpha, which (while investor-specific) is typically in the range 1%-2% per year for wealthy investors holding broad capitalization-weighted portfolios. They test six long-only factor tilts based on Barra equity factor models: (1) value (high earnings yield and book-to-market ratio); (2) momentum (high recent past return); (3) value/momentum; (4) small/value; (5) quality (value stocks with low earnings variability, leverage and volatility); and, (6) minimum volatility/value (low volatility with diversification constraint and value tilt). Their overall benchmark is the MSCI All Country World Index (ACWI). Their tax alpha benchmark derives from a strategy that harvests losses in a capitalization-weighted portfolio (no factor tilts) without deviating far from the overall benchmark. The rebalancing interval is monthly for all portfolios. Using monthly returns for stocks in the benchmark index during January 1999 through December 2013, they find that:
- Over the sample period, gross annualized factor alphas for global equity portfolios range from 0.88% (size) to 5.11% (quality).
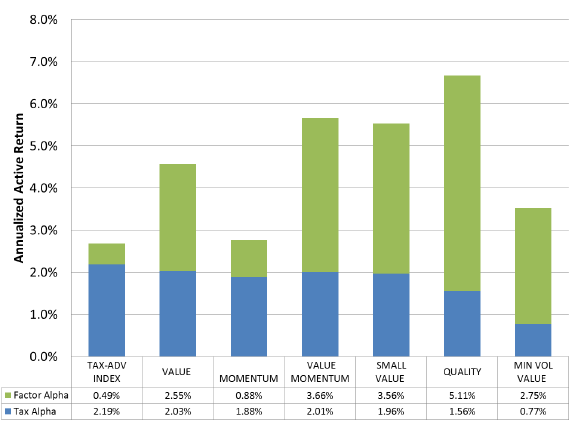
- Gross annualized tax alphas are positive for all six global factor tilt portfolios, ranging from 0.77% (minimum volatility/value) to 2.03% (value). However, all these tax alphas are smaller than the benchmark tax alpha for a capitalization-weighted portfolio. (See the chart below.)
- Gross tax alpha is markedly lower for the relatively complex (constrained) global quality and minimum volatility/value portfolios.
- Tax alpha is uncorrelated with pre-tax factor alphas, suggesting a diversification benefit.
- Results are qualitatively consistent over the last 10, 15 and 20 years.
- Results are similar for portfolios constrained to U.S. stocks and factors. The most dramatic differences are that the quality and minimum volatility/value factor tilts are much less effective for U.S. stocks.
The following chart, taken from the paper, summarizes gross annualized tax and factor tilt alphas (active returns) for a capitalization-weighted global portfolio (TAX-ADV INDEX) and the above six factor-tilted global portfolios relative to the MSCI ACWI over the sample period. Green (blue) bars represent factor tilt (tax harvesting) contributions to total annualized alpha, which ranges from 2.7% for the capitalization-weighted portfolio to 6.7% for the quality-tilted portfolio. The relatively more constraining formation rules of the quality and minimum volatility/value portfolios suppress tax alpha. Results suggest that global equity investors lacking confidence in factor alpha and having short-term gains may prefer capitalization weighting. Investors confident in factor alpha and sensitive to taxes, but not averse to volatility, may prefer the value/momentum and small/value tilts. Investors confident in factor alpha, insensitive to taxes and averse to volatility may prefer the quality and minimum volatility/value tilts.
In summary, evidence suggests that tax harvesting of capital losses to offset gains boosts gross performance of taxable smart beta portfolios, less so for complex than simple factor tilts.
Cautions regarding findings include:
- Reported returns are gross, not net. Incorporation of trading frictions from monthly portfolio rebalancing/loss harvesting would reduce returns. Since turnover may vary by factor tilt, impact of frictions may vary across smart beta portfolios, thereby changing their performance rankings.
- Results are for U.S. investors and capital gains tax rules.