Do expected investment returns as predicted by experts in surveys reliably predict actual future returns? In the October 2014 version of their preliminary paper entitled “Survey Expectations of Returns and Asset Pricing Puzzles”, Ralph Koijen, Maik Schmeling and Evert Vrugt compare survey-based expected returns to actual future returns for three major asset classes encompassing: 13 country equity market indexes; 19 currencies (versus the U.S. dollar); and, 10-year government bonds in 10 countries. They measure actual asset returns in U.S. dollars based on futures prices for equities and bonds (actual or synthetic) and forward returns for currencies. Survey-based expected returns derive from the quarterly World Economic Survey of experts, which solicits six-month expectations (“higher” or “about the same” or “lower”) for local equity prices, currency value versus the U.S. dollar and long-term government bond yield. The currency survey series commences the first quarter of 1989, while the equity and bond series commence the second quarter of 1998. They test the accuracy of survey expectations in two ways:
- Cross-sectional hedge portfolios that are each month long (short) the rank-weighted assets with the highest (lowest) survey expectations.
- Time series portfolios that are each month long (short) each asset depending on whether respective survey expectations indicate a positive (negative) return.
Analyses include testing of different lags between survey month and actual future return measurement, noting that a reliably executable strategy requires a lag of at least three months. Using quarterly survey response data and monthly futures/forward returns for the specified assets as available through September 2012, they find that:
- Survey-based expected returns relate negatively to actual future returns across countries and asset classes.
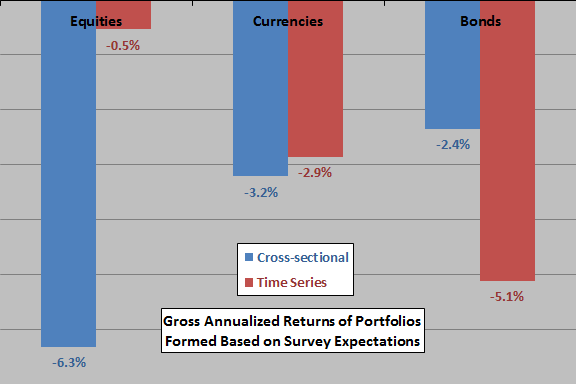
- Both cross-sectional hedge portfolios and time series portfolios informed by survey expectations generate negative future actual returns across asset classes (see the chart below).
- Results are generally robust to different lags between the survey month and the actual future return measurement interval.
- The short legs of equity hedge portfolios formed from survey expectations dominate gross outcomes, implying that stock markets viewed most negatively by survey respondents perform strongly in the future.
- Survey respondents generally expect negative (positive) returns on carry trade (momentum) strategies, consistent with simple trend extrapolation.
- For equities, survey-based expected returns are particularly negative during economic downturns.
- Survey-based return expectations depend significantly on past returns, expectations for fundamentals, measures of the global business cycle and the level of the S&P 500 Index implied volatility (VIX). However, a material part of the variation in survey-based return expectations is unexplained.
The following chart, constructed from data in the paper, summarizes gross annualized returns of portfolios based on cross-sectional ranking of survey expectations and time-series portfolios based on positive and negative survey expectations as described above. Calculations assume an executable lag of three months between the survey month and portfolio formation month. The sample period is April 1998 through September 2012 for equities and bonds and January 1989 through September 2012 for currencies.
A combined cross-sectional portfolio that averages volatility-adjusted asset class returns (return divided by volatility) and scales the result to an annual volatility of 10% produces a gross annualized return of -7.2%. For a comparable combined time series portfolio, the gross annualized return is -6.7%. Similarly combining all cross-sectional and time series portfolios produces a gross annualized return of -7.8%.
Results indicate that experts responding to the survey, in aggregate, tend to lean the wrong way with respect to actual future asset market performance.
In summary, evidence indicates that expert economists everywhere tend to lean the wrong way in timing equity, currency and bond markets.
Cautions regarding findings include:
- Survey-based expectations are qualitative. The study translates qualitative expectations into quantitative expected returns by imposing an arguably arbitrary scale on qualitative terms. In other words, the precision implied by test portfolio returns exceeds the precision inherent in survey responses.
- Actual returns are gross, not net. Accounting for portfolio reformation costs (and potentially margin calls) would reduce these returns. Costs may vary by asset class and by individual asset.
- The sample period is very short for examination of interaction between survey-based expectations and the global business cycle.