How do the major components of U.S. stock market performance behave over time? In his October 2014 paper entitled “Long-Term Sources of Investment Returns and a Simple Way to Enhance Equity Returns”, Baijnath Ramraika decomposes long-term returns from the U.S. stock market (as proxied by Robert Shiller’s S&P Composite Index) into four components:
- Dividend yield
- Inflation
- Real average change in 10-year earnings (E10)
- Change in the Cyclically Adjusted Price-Earnings ratio (CAPE, or P/E10)
He further segments this decomposition by decade. Using his decomposition by decade for 1881 through 2010 (13 decades), we find that:
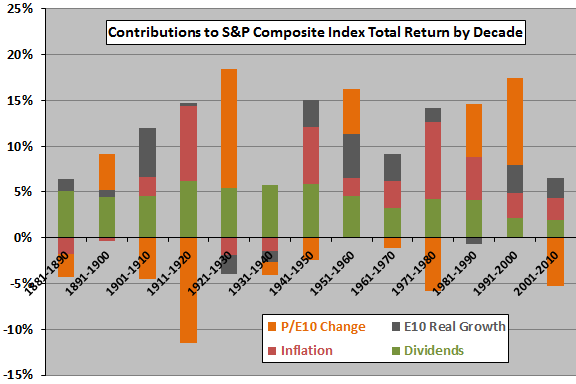
The following chart, constructed from data in the paper, summarizes annualized values of the four components of U.S. stock market returns by decade over the sample period. Most notable is the widely varying and sometimes very large contribution of change in P/E10 to total return. Also, the contribution from:
- Dividends declines markedly in recent decades (as share buybacks displace dividends).
- Inflation is positive (negative) during nine (four) decades.
- E10 is positive (negative) during ten (three) decades.
- Change in P/E10 is positive (negative) during five (eight) decades.
For additional insights, we look at correlations among components.
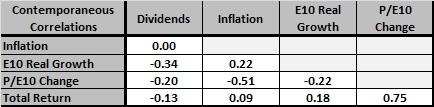
The following correlation table relates each component of U.S. stock market total return pairwise to the other components based on same-decade values. Some implications appear to be:
- Higher dividends tends to suppress real earnings growth and the valuation ratio.
- Real earnings tend to grow faster when inflation is higher.
- Higher inflation means a lower valuation ratio.
- Change in the valuation ratio is the principal driver of total return.
However, the sample is very small in terms of number of decades.
Do any of the components materially lead future total return?
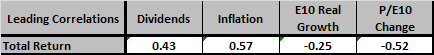
The next correlation table relates each component of U.S. stock market total return to next-decade total return. Some implications appear to be:
- Higher dividends last decade imply higher total return.
- Higher inflation last decade implies higher total return.
- Higher real earnings growth last decade suggests lower total return.
- Higher growth in the valuation multiple last decade implies lower total return.
These findings may derive from tendencies of the components to revert at a decade horizon.
Again, the sample is very small in terms of number of decades.
In summary, evidence from available data suggests some reversion in U.S. stock market return components from decade to decade, especially for inflation and the change in valuation ratio (which are interrelated).
Cautions regarding findings include:
- As noted, the sample is very small in terms of decades.
- The Shiller methodology involves some estimation/interpolation and somewhat blurs return calculations (the index level for a month is the average daily close during the month). Using decade measurement intervals mitigates these concerns.
The author concludes that “a simple way to enhance investment returns of a portfolio over the long-term is to invest in businesses that have the ability to grow their business values at above-average rates in a sustainable manner. Such businesses possess significant competitive advantages that are sustainable.” However, the author does not explain how to identify such companies.