Do predictable monthly outflows from and inflows to mutual funds drive the Turn-of-the-Month (TOTM) effect, a concentration of positive stock market returns around the turns of calendar months? In their November 2014 paper entitled “Dash for Cash: Month-End Liquidity Needs and the Predictability of Stock Returns”, Kalle Rinne, Matti Suominen and Lauri Vaittinen explore TOTM with focus on the effects of: (1) month-end flows from mutual funds to retirees and dividend-collecting investors; and, (2) beginning-of-month flows from working investors to mutual funds. To account for trade settlement rules, funds must sell stocks at least three trading days before the end of the month to raise cash for expected month-end outflows. The authors therefore define a TOTM interval from three trading days before through three trading days after the last trading day of the month. They also consider intervals of five trading days before TOTM to measure the effect of fund selling and five trading days after TOTM to measure reversion from fund buying. Using daily value-weighted, (mostly) total return stock market indexes for the U.S. since 1926 and for 24 other developed markets as available during January 1980 through January 2014, and data for individual U.S. stocks and mutual funds during January 1980 through December 2013, they find that:
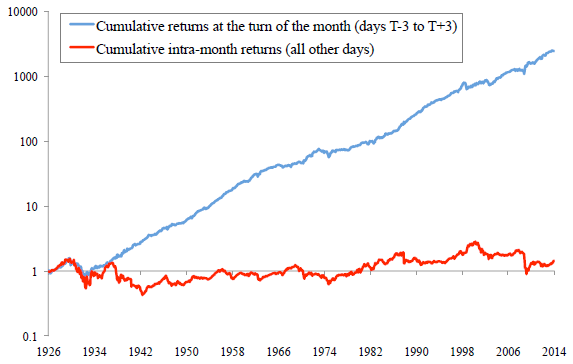
- Since 1926, nearly all gross cumulative return of the U.S. stock comes from the seven-day TOTM interval, with 40% lower volatility than a buy and hold strategy (see the first chart below).
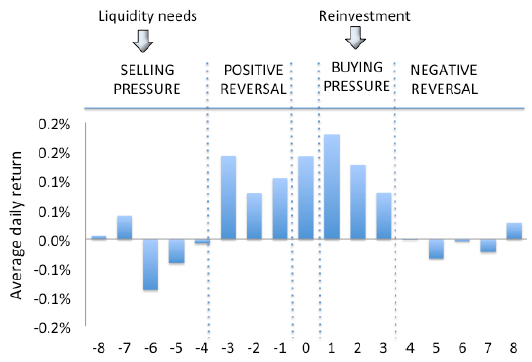
- Since 1980, average U.S. daily stock market returns during the seven-day TOTM interval are significantly higher than those during the five trading days before and the five trading days after this interval (see the second chart below). The pattern tends to strengthen over time with increased mutual fund participation.
- Evidence from 24 other developed markets is similar, with the beginning (end) of the TOTM interval statistically evident in 18 (12) country indexes. Evidence is stronger in countries where mutual fund market share is higher.
- In the U.S.:
- Stocks that decline the most during the five trading days before the TOTM interval tend to rise the most during the next three trading days, and stocks that rise the most during the first three trading days of the month tend to drop the most during the next five trading days.
- TOTM effects tend to be stronger among stocks widely held by mutual funds, liquid stocks and more volatile stocks (controlling for liquidity).
The following chart, taken from the paper, compares on a logarithmic scale the gross cumulative returns for the broad, value-weighted U.S. stock market during January 1926 through December 2013 for:
- All seven-day TOTM intervals from three trading days before (T-3) to three trading days after (T+3) the last trading day of all calendar months.
- The rest of all calendar months.
Results indicate that nearly all the market cumulative return occurs during TOTM. However, incorporating the costs of entering (exiting) stocks before (after) TOTM would results in a net cumulative TOTM return materially smaller than the gross cumulative TOTM return.
The next chart, also from the paper, shows the average daily returns of the broad value-weighted U.S. stock market from eight trading days before (-8) to eight trading days after (8) the last trading day of the month (day 0) during January 1980 through December 2013. Results suggest that:
- Fund selling to raise cash depresses stock prices during days -8 through -4.
- Prices recover from this selling during days -3 through 0.
- Fund buying to invest new inflows elevates stock prices during days 1 through 3.
- Prices revert lower during days 4 through 8.
Patterns are similar in many other developed markets.
In summary, evidence from developed stock markets supports belief in linkages between mutual fund outflows and inflows and TOTM return patterns.
Cautions regarding findings include:
- As noted, the cumulative return illustration is gross, not net. Frictions from monthly trading to exploit findings would reduce these returns. Frictions may vary over time and across country markets.
- Detailed results do not address the several trading days of the month not included in the intervals analyzed.
See also “Turn-of-the-Month Effect Persistence and Robustness” and “Turn-of-the-Month Effect in Stock Markets Around the World”.