Referring to “Leading Economic Index and the Stock Market”, a subscriber inquired about using the Conference Board’s Leading Economic Index (LEI) for the U.S. to generate long-term U.S. stock market timing signals, as follows:
“How about using the LEI in the following fashion?
Buy when the LEI rises by 1.0 % from its lowest point in the prior six months.
Sell when the LEI falls by 1.5% from its highest point in the last six months.
I used 1% as a buy because bear markets can end abruptly, not because I was torturing the data to confess. You could use 1.5% and I think still have robust results…changes in trend, which are rare, seem to be helpful. I bought the LEI data from the Conference Board and did some testing by hand using the above going back to 1969. I think I found some interesting results. …It gave early sell in 2006… The signal date was the date of the release… Most of the benefit of the trading system comes within the last 14 years.”
Using the monthly change in LEI data from archived Conference Board press releases during June 2002 through October 2014 (146 months), we find that:
Publicly available information for the U.S. LEI series is insufficient to replicate the full analysis as specified, but does suggest some cautions about using the series to generate market timing signals over the long term. Central to the cautions is the following statement that appears in each January Conference Board press releases announcing the U.S. LEI for December (underlining added):
“This month’s release incorporates annual benchmark revisions to the composite economic indexes, which bring them up-to-date with revisions in the source data. These revisions do not change the cyclical properties of the indexes. The indexes are updated throughout the year, but only for the previous six months. Data revisions that fall outside of the moving six-month window are not incorporated until the benchmark revision is made and the entire histories of the indexes are recomputed. As a result, the revised indexes, in levels and month-on-month changes, will not be directly comparable to those issued prior to the benchmark revision.”
Two implications from this statement are:
- Each month, the Conference Board revises U.S. LEI data for the last six months.
- Each year, the Conference Board revises the entire series.
The Conference Board asserts that such differences “do not change the cyclical properties of the index,” but the changes may affect backtested signal thresholds.
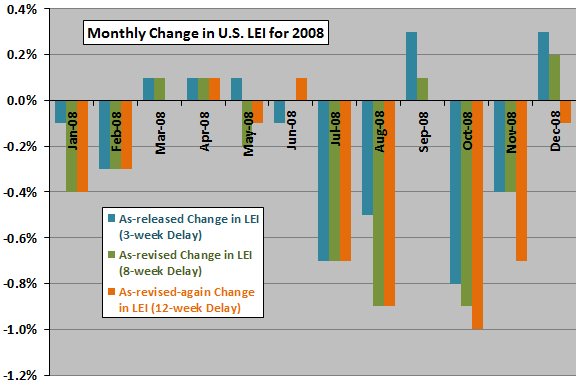
The following chart is a concrete example based on the Conference Board U.S. LEI press releases from February 2008 through March 2009. Each release gives the change in LEI for the past month and revisions of the change in LEI for the preceding two months. Especially for the turbulent months of August 2008 through December 2008, the first revision is very different from the initial release, and the second revision is sometimes different from the first revision.
The chart suggests that a signal based on the most recent seven months of data may differ depending on whether the historical series consists of:
- All initial release values (possible to know in real time).
- The current initial release value and iteratively revised values for the past six months (possible to know in real time).
- Revised values retrieved during some subsequent year (not possible to know in real time, because the revised data are not available until months or years after the month measured and the initial release date).
- Revised values retrieved during some other subsequent year (not possible in real time).
For perspective, we look at the initial release-second revision differences for monthly change in LEI over a longer period.
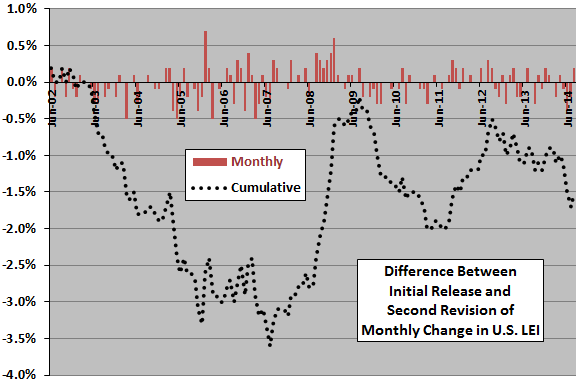
The next chart tracks differences between initial releases and corresponding second revisions of monthly change in LEI during July 2002 through August 2014, both by month and cumulatively. Notable points are:
- The average absolute difference between the initial monthly change in U.S. LEI and the second revision is 0.16%.
- The initial release appears to be persistently too low (high) compared to second revisions during equity bull (bear) markets.
The latter point suggests that turning points based on initial release data may differ from those based on revised data. The revisions appear to help the economic data “catch up” to the stock market during the two months after initial release.
Other cautions when a model generates relatively few signals over time are:
- Signal performance must be dramatic to achieve statistical reliability.
- The kind of data instability described above may have a material effect on overall signal performance (one or two dramatic revisions could have a large effect).
- Overall performance may be sensitive to the signal threshold specified (snooping bias is generally larger for a small set of signals than for a large one). In other words, performance of a signal may be sensitive to the shape of one or two extreme downturns/upturns.
The data instability issue appears in other economic data series. There may be preliminary and revised data for recent measurements and longer term revisions as the provider (e.g., the U.S. government) changes assumptions, such as seasonal weighting factors. The revised series may be materially different from one a few years old. The trade-off in updating inputs and adjusting assumptions is: (1) maintaining the best forward-looking model versus (2) devaluing the series with respect to realistic backtesting. Sometimes vintage series are available that show the data as they existed at each release date, but analysis using a different series for each release date becomes overwhelming
In summary, evidence from monthly releases of the Conference Board’s Leading Economic Index for the U.S. suggests that the data instability inherent in the revision process may disrupt its use for reliable long-term U.S. stock market timing.
Cautions regarding findings:
- The publicly available sample is short in terms of number of economic and bull/bear stock market cycles.
- It is possible that useful predictive power survives the data instability issue. However, proving usefulness using monthly series vintages would be very difficult.