In an effort to generate more responsive exchange-traded fund (ETF) momentum switching, a subscriber proposed a version of the “Simple Asset Class ETF Momentum Strategy” (SACEMS) that measures ETF returns from the lowest daily close within the momentum measurement interval rather than the monthly close at the beginning of the momentum measurement interval. To investigate, we run a competition between these alternative ways of measuring momentum as applied to the following eight asset class exchange-traded funds (ETF), plus cash:
PowerShares DB Commodity Index Tracking (DBC)
iShares MSCI Emerging Markets Index (EEM)
iShares MSCI EAFE Index (EFA)
SPDR Gold Shares (GLD)
iShares Russell 1000 Index (IWB)
iShares Russell 2000 Index (IWM)
SPDR Dow Jones REIT (RWR)
iShares Barclays 20+ Year Treasury Bond (TLT)
3-month Treasury bills (Cash)
Specifically, the baseline strategy allocates all funds at the end of each month to the ETF or cash with the highest total return over the past five months (5-1). The alternative strategy allocates all funds at the end of each month to the ETF or cash with the highest return measured from its low during the last 105 trading days (about five months) to the end of the current month (Max 5-1). Using daily dividend-adjusted closing prices for the asset class proxies and the monthly yield for Cash during July 2002 (or inception if not available then) through December 2014 (150 months), we find that:
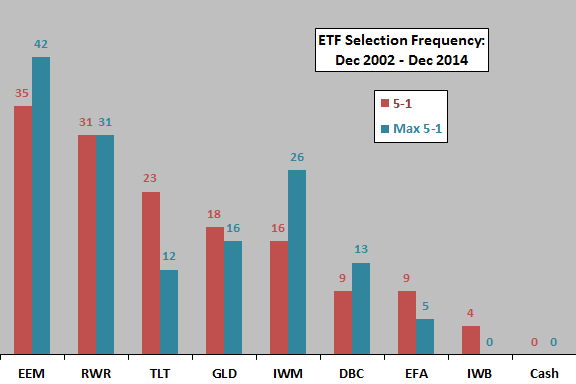
The following chart shows the distribution of asset class ETF winners for the 5-1 and Max 5-1 strategies. Note that number of ETFs available increases over time, as follows:
- EFA, IWB, IWM, RWR and TLT are available over the entire sample period.
- EEM is available starting April 2003.
- GLD is available starting November 2004.
- DBC is available starting February 2006.
It appears that Max 5-1 tends to pick more volatile assets than 5-1. This observation makes sense given the reliance of Max 5-1 on the most extreme returns during the momentum measurement interval.
How do the winning sets of ETFs translate into investment performance?
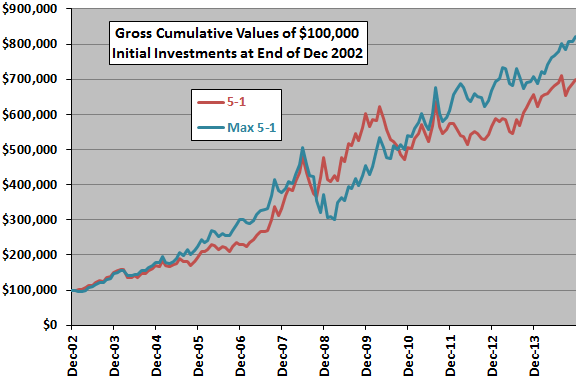
The next chart compares the cumulative values of $100,000 initial investments in the 5-1 and Max 5-1 strategies. Calculations derive from the following assumptions:
- Reallocate/rebalance at the close on the last trading day of each month (assume that ETF momentum can be calculated just before the close).
- Measure Cash momentum for both strategies as a monthly compounded return over the past five months (a low-to-end return calculation does not make sense for Cash).
- Ignore trading frictions and tax implications of trading.
Based on terminal value, Max 5-1 outperforms 5-1, but appears to suffer a larger maximum drawdown. Specifically, over the entire sample period:
- Average gross monthly return for 5-1 (Max 5-1) is 1.51% (1.63%).
- Standard deviation of monthly returns for 5-1 (Max 5-1) is 5.50% (5.70%).
- The ratio of average gross monthly return to standard deviation of monthly returns, a rough gross monthly Sharpe ratio, is 0.27 (0.29) for 5-1 (Max 5-1).
- Maximum drawdown for 5-1 (Max 5-1) based on gross monthly returns is -24% (-40%).
Given the relatively short sample period (especially in terms of number of equity bull and bear markets) and the variabilities of returns, the difference in results is not compelling. The greater maximum drawdown for Max 5-1 may make some investors reject it.
5-1 (Max 5-1) generates 58 (55) ETF switches over the sample period, so trading friction is not crucial to picking one strategy over the other.
In summary, evidence from simple tests over a limited sample period suggests that the Max 5-1 version of the Simple Asset Class ETF Momentum Strategy may outperform the basic 5-1 version based on some performance metrics, but may suffer larger drawdowns during crises.
Cautions regarding findings include:
- As noted, sample size is modest (30 independent five-month momentum ranking intervals for five ETFs and fewer for three others) and includes only one full equity bear market.
- Use of 105 trading days for Max 5-1 and five months for 5-1 as momentum measurement intervals largely accounts for the difference in terminal values between the two strategies. In other words, generating 5-1 winners based on past 105-day returns rather than past five-month returns increases the 5-1 terminal value, likely per the kind of outcome variability in “Optimal Monthly Cycle for Simple Asset Class ETF Momentum Strategy?”.