Does accounting for the difficulty of covering short positions enhance the power of short interest to predict stock returns? In the February 2015 draft of their paper entitled “Days to Cover and Stock Returns”, Harrison Hong, Weikai Li, Sophie Ni and Jose Scheinkman examine days-to-cover short interest (DTC) of individual stocks as a return predictor. Their basic metric for DTC is monthly short interest divided by same-month average daily share turnover. They hypothesize that:
- Short-sellers prefer positions they can close quickly without dominating trading volume.
- A large DTC indicates that doing so would be difficult.
- When DTC is high, short sellers must therefore believe strongly that the stock is overpriced.
The main approach of the study is to measure the performance of a hedge portfolio that is each month long (short) the equally weighted or value-weighted tenth or decile of stocks with the lowest (highest) DTC or short interest ratio (SR). Using monthly returns, short interest, shares outstanding, turnover, stock loan fees, stock/firm characteristics and institutional ownership and daily trading volumes for NYSE/AMEX/NASDAQ stocks as available during January 1988 through December 2012, they find that:
- Average SR rises steadily from about 1% to a peak of about 6% in 2008, and then falls to about 4% in recent years.
- Average DTC is 5.5 days, rising from a low of 4 days to 8 days in recent years.
- Early in the sample period, the correlation of monthly SR and DTC is 0.3, rising to 0.5 after 2000.
- DTC is a stronger predictor of stock returns than SR.
- A hedge portfolio that is each month long (short) the equally weighted decile of stocks with the lowest (highest) SRs generates a gross average monthly return of 0.71%. For value weighting this return drops to 0.29%.
- A hedge portfolio that is each month long (short) the equally weighted decile of stocks with the lowest (highest) DTCs generates a gross average monthly return of 1.19%. For value weighting this return drops to 0.67%.
- The equally weighted DTC hedge portfolio outperforms SR by:
- 0.37% (0.53%) per month in the first (second) half of the sample period.
- 0.41% (0.62%) per month in the NYSE-AMEX (NASDAQ) subsample.
- The annualized gross Sharpe ratio for the equally weighted DTC (SR) hedge portfolio is 1.3 (0.5). Trailing ten-year gross annualized Sharpe ratios for DTC portfolio are almost always greater than 1.0, while those for the SR portfolio are consistently around 0.5.
- Based on gross cumulative returns, the equally weighted DTC hedge portfolio (terminal return 2900%) dramatically outperforms the equally weighted SR hedge portfolio (terminal return 500%), especially after 2000. Value-weighted returns are less impressive.
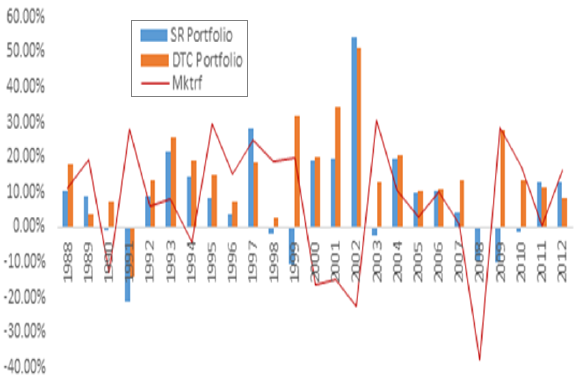
- The equally weighted DTC hedge portfolio delivers positive gross annual returns in 92% of years and beats the equally weighted SR hedge portfolio in 80% of years (see the chart below).
- However, because DTC short positions are difficult to cover, these positions suffer large losses during the 2008 ban on shorting financial stocks.
- DTC largely subsumes the return forecasting power of SR.
- Post-2000, SR is a very weak and statistically insignificant stock return predictor, whereas DTC remains statistically significant.
- Since 2003, DTC is as powerful a stock return predictor as stock loan fee, but is distinct from it.
- DTC predictive power is robust to its exact construction and to control for stock illiquidity.
The following chart, taken from the paper, summarizes gross annual returns during 1988 through 2012 for three strategies:
- A hedge portfolio that is each month long (short) the equally weighted decile of stocks with the lowest (highest) SRs.
- A hedge portfolio that is each month long (short) the equally weighted decile of stocks with the lowest (highest) DTCs.
- The broad U.S. stock market return in excess of the risk-free rate (Mktrf).
The DTC (SR) portfolio generates positive gross annual returns in 23 (17) of 25 years. The DTC portfolio outperforms the SR portfolio in 20 of 25 years.
In summary, evidence indicates that days-to-cover short interest is a strong and consistent predictor of gross U.S. stock returns.
Cautions regarding findings include:
- The returns and Sharpe ratios above are gross, not net. Trading frictions and shorting costs for monthly portfolio reformation would reduce reported performance. Shorting as specified may not always be feasible.
- As noted, emergency regulatory constraints on shorting can disrupt exploitation of findings (as in 2008).
- Timely collection and processing of data required to exploit findings may be problematic for many investors, or costly if delegated to a manager.