Do factors that predict returns in U.S. stock data also work on global stock markets at the country level? In the May 2015 version of their paper entitled “Do Quantitative Country Selection Strategies Really Work?”, Adam Zaremba and Przemysław Konieczka test 16 country stock market selection strategies based on relative market value, size, momentum, quality and volatility. For each of 16 factors across these categories, they sort country stock markets into fifths (quintiles) and measure the factor premium as return on the highest minus lowest quintiles. They consider equal, capitalization and liquidity (average turnover) weighting schemes within quintiles. They look at complementary large and small market subsamples, and complementary open (easy to invest) and closed market subsamples. Using monthly total returns adjusted for local dividend tax rates in U.S. dollars for 78 existing and discontinued country stock indexes (primarily MSCI) during 1999 through 2014, they find that:
- Earnings-to-price ratio (earnings yield) stands out as a useful indicator of country-level stock market gross value premiums (see the chart below).
- Momentum strategies are unreliable at the country level, effective only in small markets and counterproductive in large markets.
- Low-debt markets, especially large ones, tend to outperform high-debt markets on a gross basis.
- Illiquid markets tend to outperform liquid markets on a gross basis.
- A positive volatility-return relationship concentrates in large markets.
- Quality and volatility factors perform very differently in open and closed markets.
- Most return patterns are uneven across the five quintiles, with abnormal returns concentrating in extreme markets.
The following chart, constructed from data in the paper, summarizes gross annual country-level equity factor Sharpe ratios for 15 factors and three market weighting schemes during 1999-2014. For each factor, performance derives from the difference in returns between the quintile of countries with the highest expected return and the quintile of countries with the lowest expected return (somewhat different from the approach in the paper). Specifically, country-level factor premiums come from:
B/M – highest minus lowest book-to-market ratio quintiles.
E/P – highest minus lowest earnings yield quintiles.
CF/P – highest minus lowest cash flow yield quintiles.
DY – highest minus lowest dividend yield quintiles.
Cap – smallest minus largest market capitalization quintiles.
Mom12 – highest minus lowest return over the last 12 months quintiles.
Mom9 – highest minus lowest return over the last 9 months quintiles.
Mom6 – highest minus lowest return over the last 6 months quintiles.
Mom3 – highest minus lowest return over the last 3 months quintiles.
ROA – highest minus lowest return on assets quintiles.
Lev – lowest minus highest leverage ratio (indebtedness) quintiles.
Liq – highest minus lowest corporate liquidity (cash holdings) quintiles.
Turn – lowest minus highest share turnover (market liquidity) quintiles.
SD – highest minus lowest standard deviations of returns quintiles.
VaR – highest minus lowest value at risk quintiles.
Ivol – highest minus lowest idiosyncratic volatility quintiles.
Results suggest that earnings yield (high E/P) and market illiquidity (low turnover) carry the most reliable gross premiums at the country level over the sample period, and that momentum is not a reliable factor.
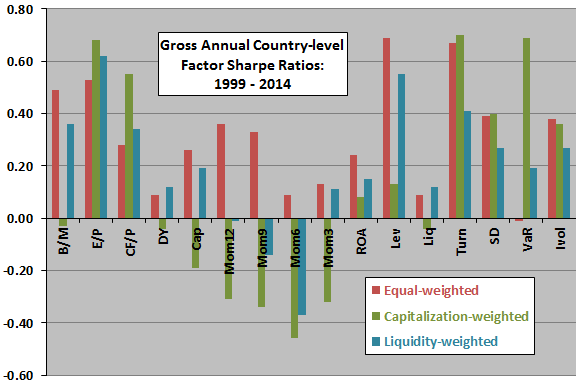
In summary, evidence from the past 16 years suggests that earnings yield and illiquidity are among the best indicators of gross country-level stock market performance, but momentum is not a good indicator.
Cautions regarding findings include:
- The sample period is short relative to many factor measurement intervals (only 16 independent one-year intervals).
- The small/large and open/closed country market subsamples are small for quintile formation.
- Testing many factors and weighting schemes on the same data introduces snooping bias, such that the best-performing strategies likely overstate expectations.
- The test assets are indexes rather than tradable funds, ignoring the costs of maintaining liquid funds and thereby overstating series returns. These costs probably vary substantially across countries.
- The study does not account for trading frictions associated with monthly reformation/rebalancing of quintile portfolios. These frictions would lower returns and may vary considerably across countries.